Posts Tagged ‘Mobile Apps’
Retail mCommerce Revenues, 2012 vs 2013 [CHART]
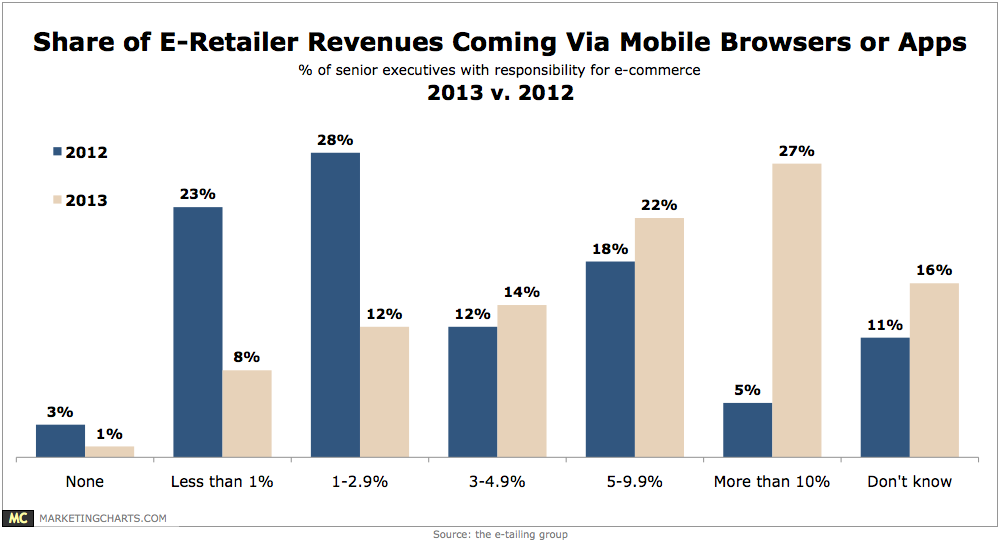
29% of eCommerce executives say that more than 20% of their traffic comes via mobile browsers or mobile applications, a marked increase from just 3% who reported that level of traffic last year.
Read MoreCPG Mobile Advertising Post-Click Actions, 2012 [CHART]
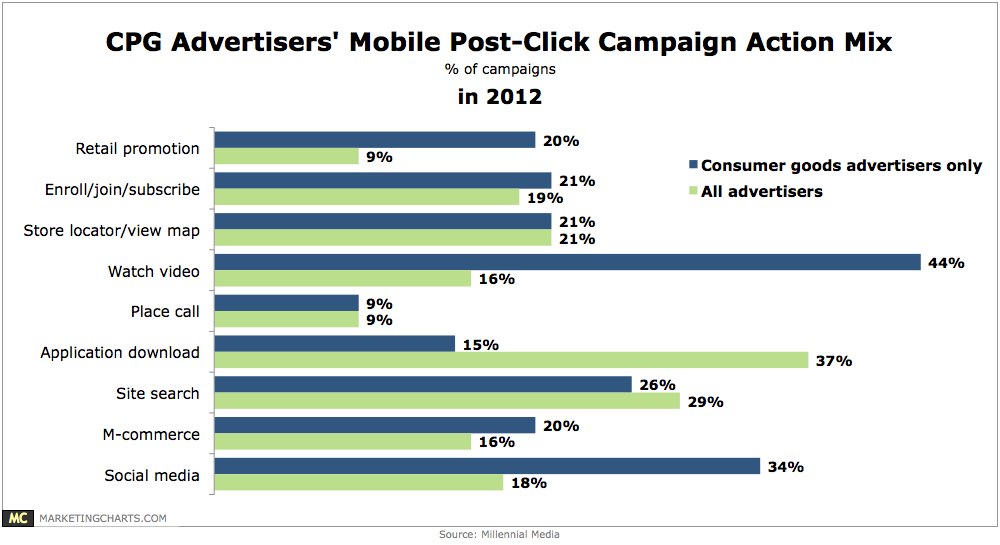
CPG brands were more focused on encouraging consumers to watch video, with 44% of the campaigns incorporating a video aspect (compared to 16% on average).
Read MoreMobile Commerce App Usage By OS, April 2013 [CHART]
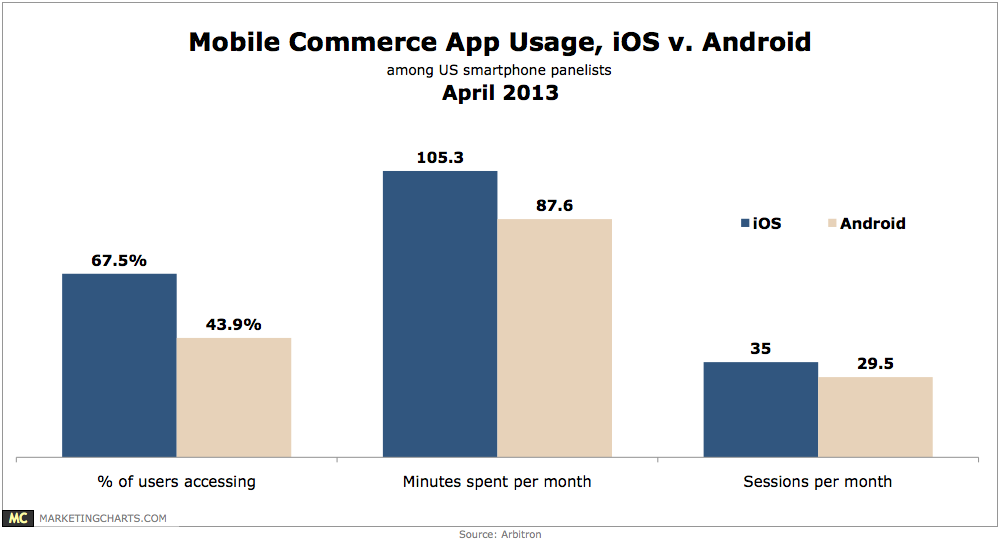
iPhone owners are 54% more likely than Android owners to use mobile applications for commerce.
Read MoreWeekly Time Spent Using IM/Chat Apps By Mobile OS, April 2013 [CHART]
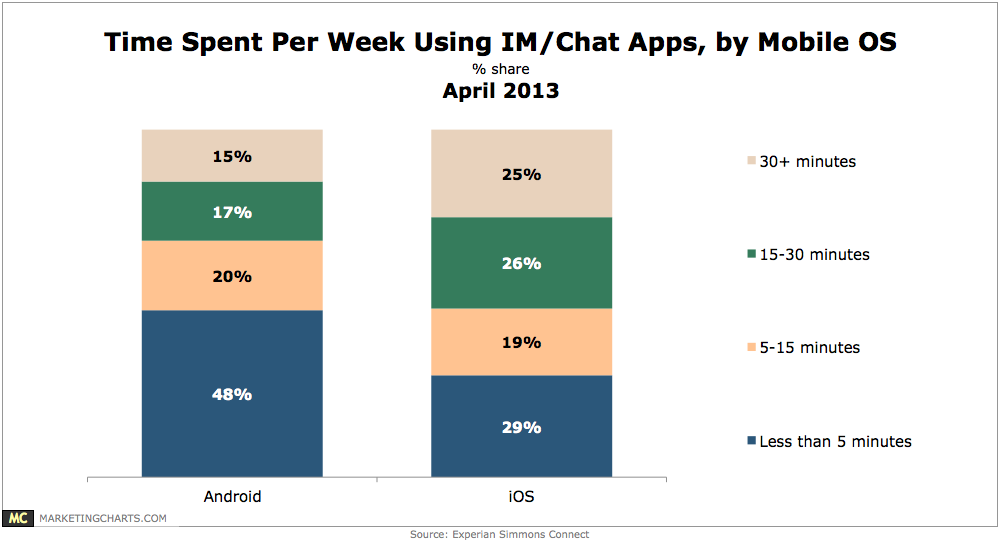
Android mobile owners are 2.4 times more likely than iPhone owners to use mobile IM/chat applications such as Whatsapp and Kik Messenger, but iPhone owners are heavier users of the apps.
Read MoreMobile Payment Adoption, April 2013 [CHART]
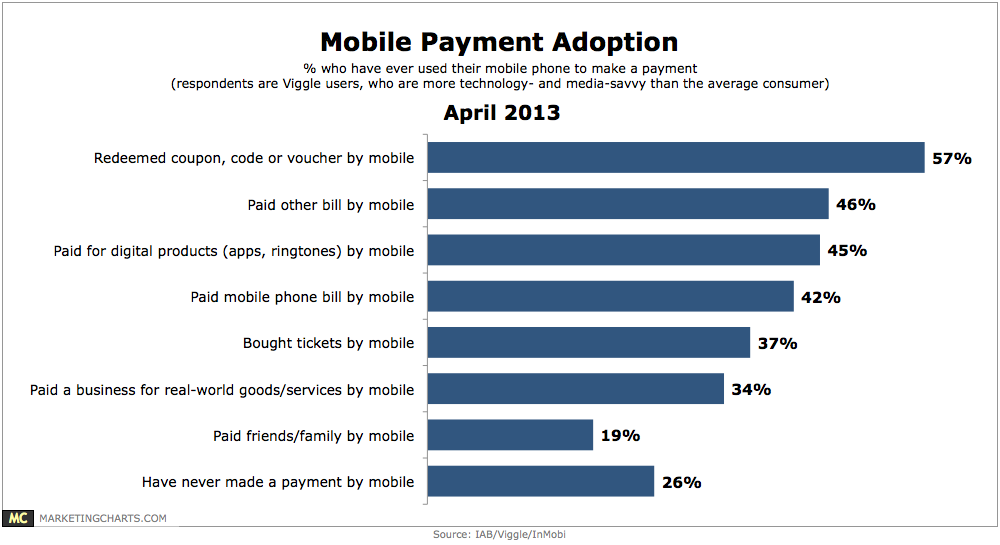
57% of tech-savvy respondents have redeemed a coupon, code or voucher by mobile, while more than 4 in 10 have paid for digital products via their device.
Read MoreHow American Women Research Products, March 2013 [CHART]
Only 6% of American women reported still researching products primarily in-store, while another 5% asked friends and family for recommendations most often.
Read MoreTop Mobile Apps Used For Local Business Search, December 2012 [TABLE]
Google Maps was the No. 1 app used for local searches on phones and tablets, at 35% and 25%, respectively.
Read MoreMobile Americans Who Use Search/Navigation Sites or Apps, April-December 2012 [CHART]
In only eight months, the number of overall US searches on mobile phones and tablets rose 21%.
Read More
Time Spent On iOS & Android Devices By Activity, April 2013 [CHART]
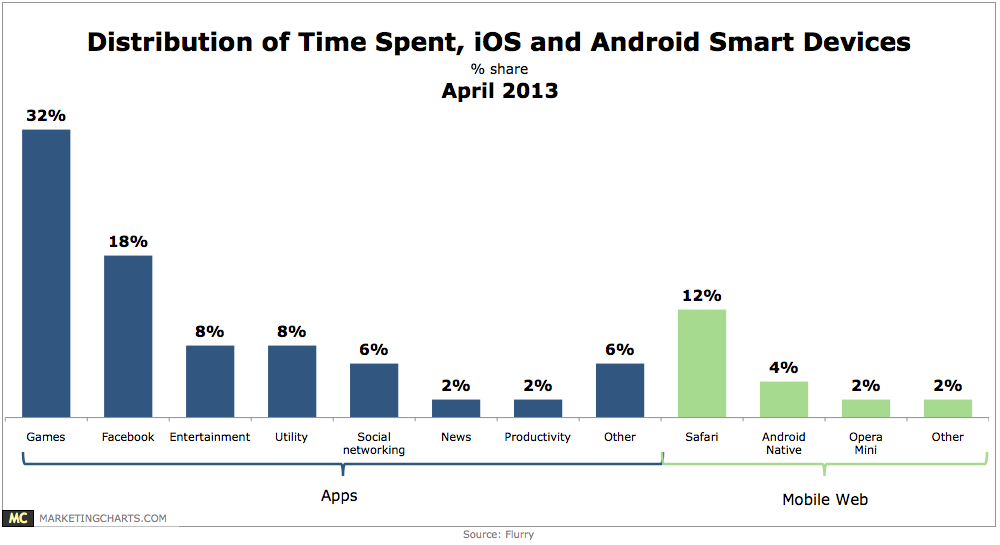
Android and iOS smart phone and tablet users spend an average of 2 hours and 38 minutes per day on their devices.
Read More