Posts Tagged ‘Mobile Apps’
Demographics of Messaging App Users
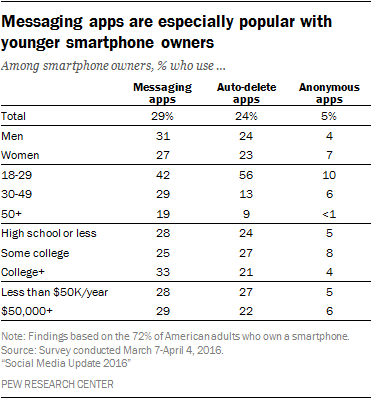
Some 56% of smartphone owners ages 18 to 29 use auto-delete apps, more than four times the share among those 30-49 (13%) and six times the share among those 50 or older (9%).
Read MoreDemographics Of Instagram Users [TABLE]
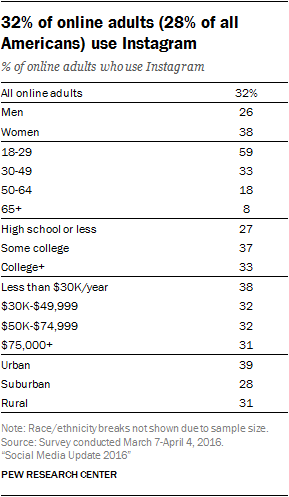
Around one-third of online adults (32%) report using Instagram – roughly the same share as in 2015, when 27% of online adults did so.
Read MoreApp User Retention Rates – 2012-2016 [CHART]
![App User Retention Rates - 2012-2016 [CHART]](https://e-strategy.com/wp-content/uploads/2016/10/App-User-Retention-Rates-2012-2016.png)
Mobile users spend the majority of their app time with their single favorite one.
Read MoreTop Elements Of A Good Mobile Experience [CHART]
![Top Elements Of A Good Mobile Experience [CHART]](https://e-strategy.com/wp-content/uploads/2016/10/Top-Elements-Good-Mobile-Experience.png)
Convenience, security and speed are the most important elements of a good mobile experience.
Read MoreTop Factors For Mobile Shoppers [CHART]
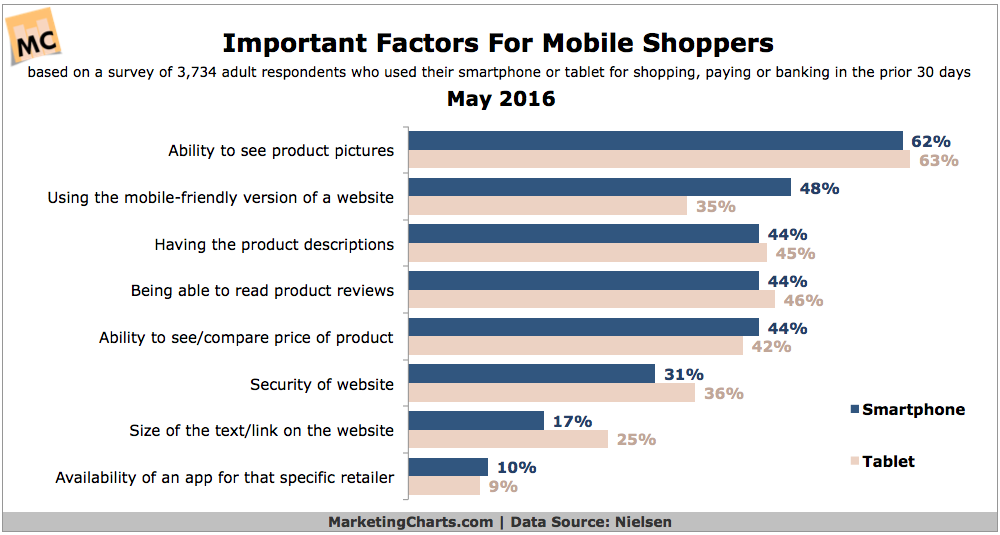
Mobile accounted for roughly 1 in every 6 retail dollars spent online during Q4 2015.
Read MoreFacebook Live Video Awareness [CHART]
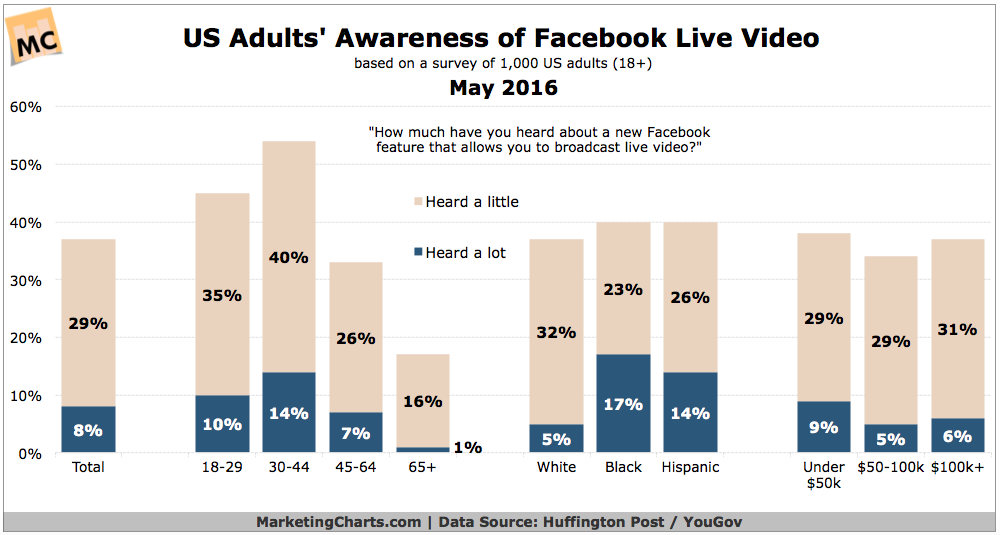
Some 37% of US adults have heard about Facebook’s new feature allowing them to broadcast live video.
Read MoreWeekly Time Spent With Select Media [TABLE]
US consumers spend an average of 35 hours per week watching live and timeshifted television.
Read MoreAverage Minutes Visitors Spent On News Sites, Mobile vs Desktop [CHART]
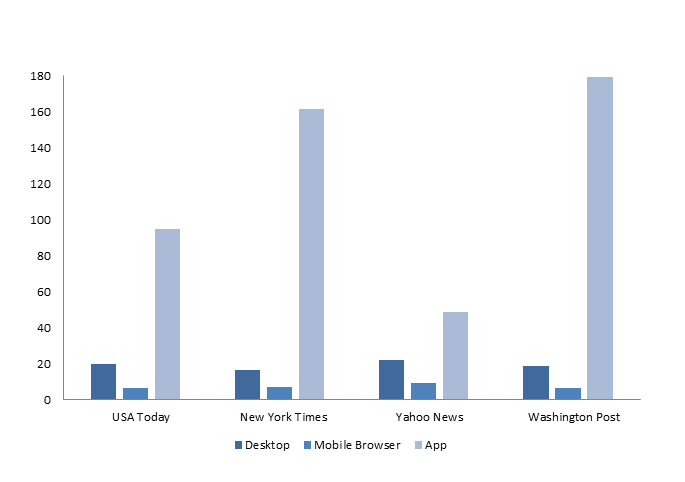
By 2020, two-thirds of all online activity is expected to take place on mobile devices.
Read MoreMost Popular Mobile App Types [CHART]
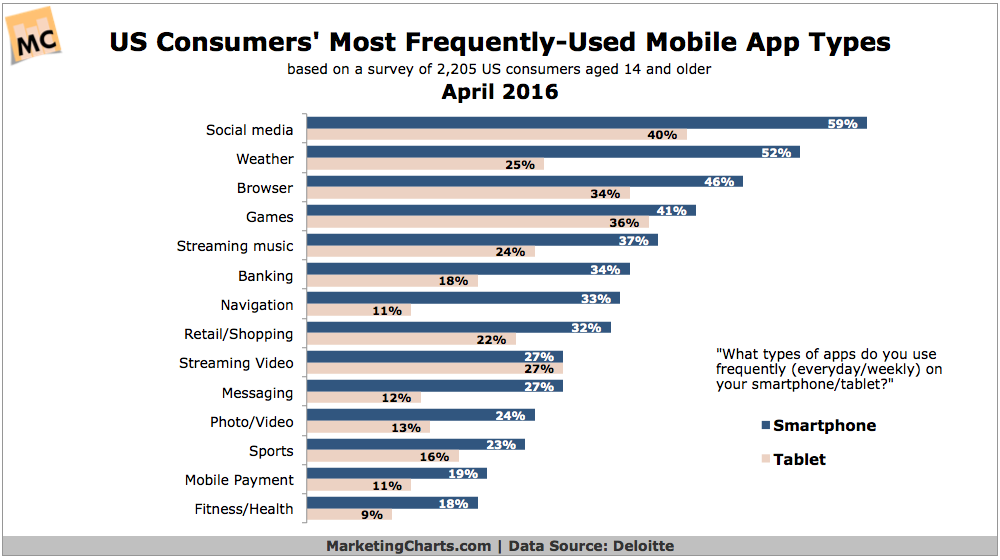
Consumers aged 14 and older access apps more frequently on smartphones than tablets, with social media the top app type on both devices.
Read MoreSnapchat Growth, 2014-2020 [CHART]

In the battle among the social networks to attract new users, 2016 will be a banner year for Snapchat.
Read More