Posts Tagged ‘Metrics’
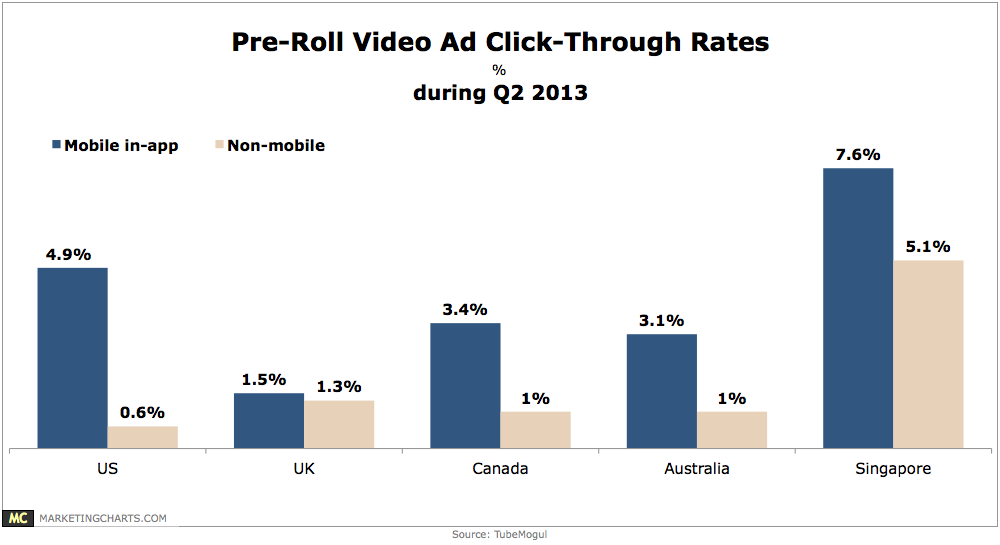
Pre-Roll Video Ad Click-Through Rates, Q2 2013 [CHART]
Slightly more than half of mobile in-application pre-roll ads were completed in the US during Q2.
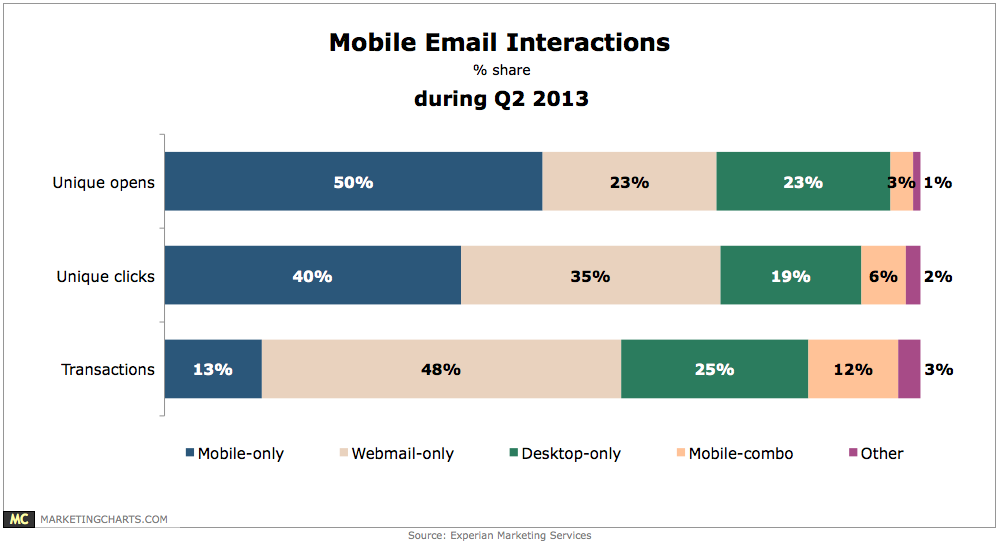
Read MoreMobile Email Interactions, Q2 2013 [CHART]
Fully half of email opens during Q2 occurred only on a mobile device.
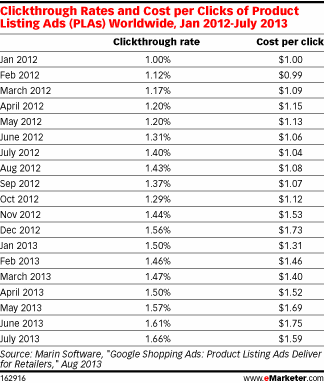
Read MoreProduct Listing Ad Metrics, January 2012-July 2013 [TABLE]
The outlook for PLAs is good given that the ads do seem to garner higher clickthrough rates (CTRs) every month.
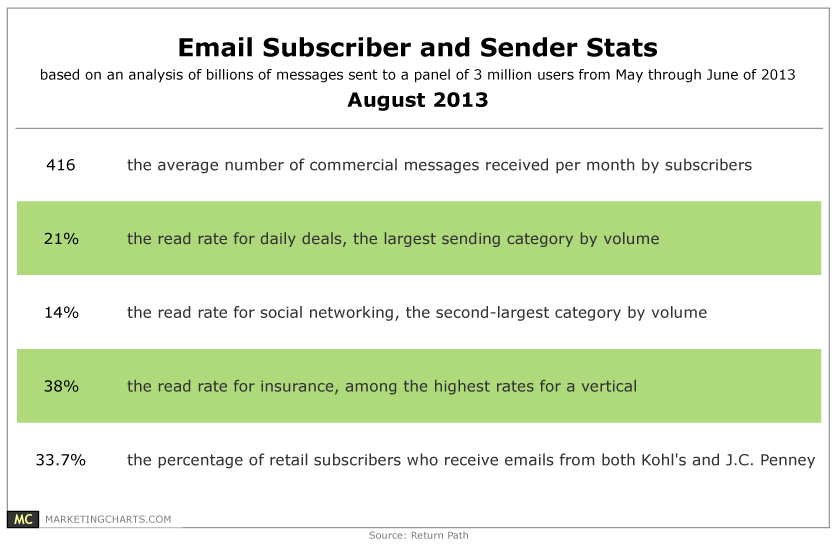
Read MoreEmail Subscriber & Sender Stats, August 2013 [TABLE]
The average subscriber receives 416 commercial emails per month, per new figures released by Return Path.
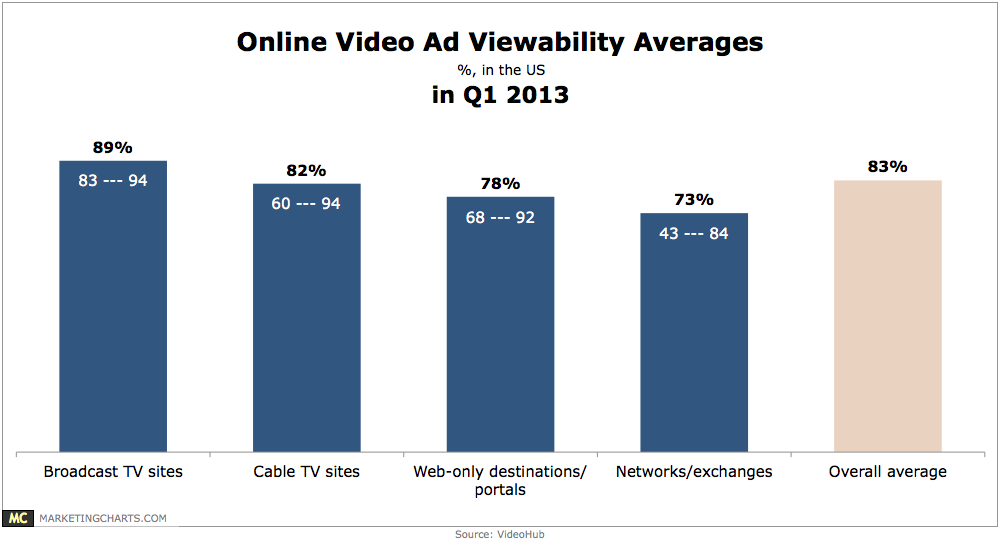
Read MoreOnline Video Ad Viewability Averages By Source, Q1 2013 [CHART]
During the first quarter, average viewability for online video ads in the US was 83%, although rates varied widely among properties.
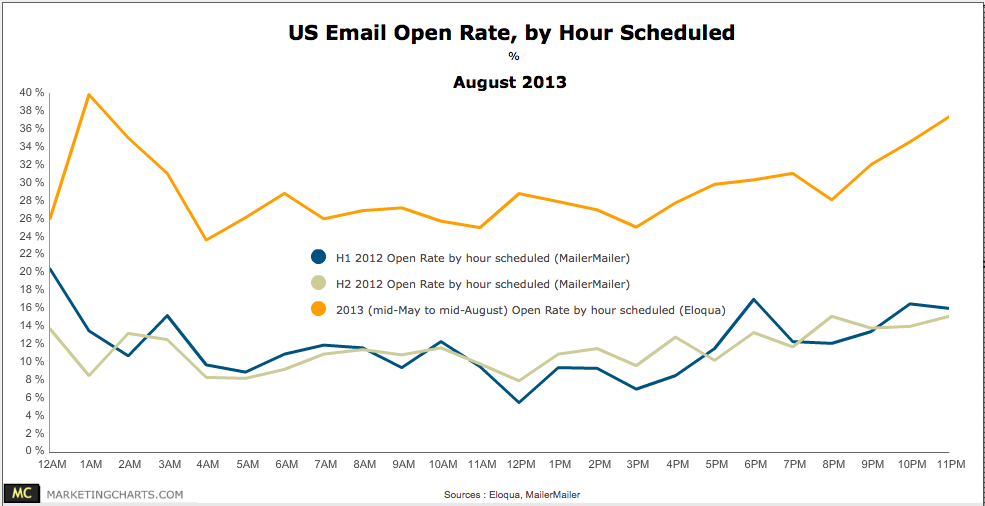
Read MoreEmail Open Rate By Hour Scheduled, August 2013 [CHART]
MailerMailer recently published the results of its annual analysis of email marketing metrics, with a section devoted to open and click rates by hour scheduled as well as by day of the week.
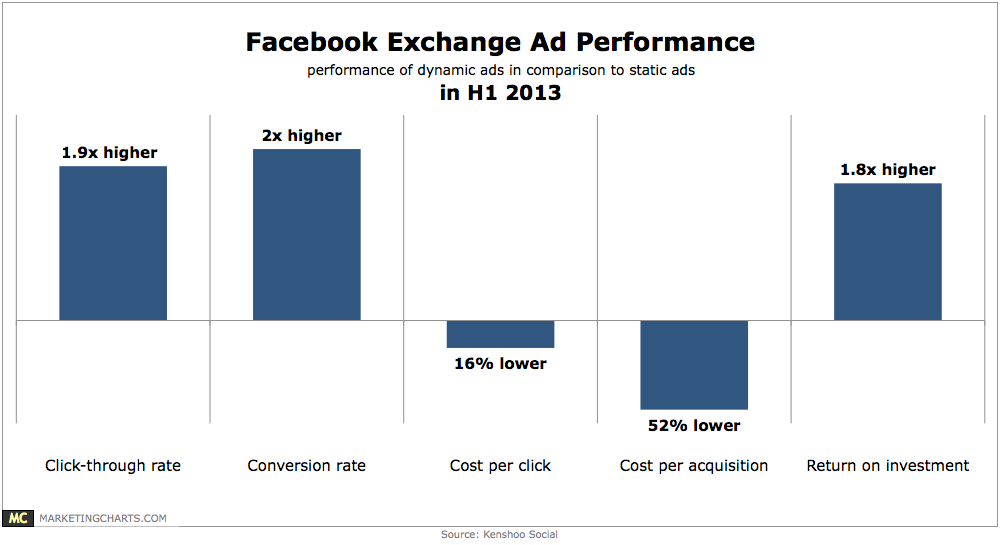
Read MoreFacebook Exchange Ad Performance, H1 2013 [CHART]
Facebook exchange units can deliver an ROI comparable to other search and direct response channels, but that’s more likely to be the case for dynamic than static units.
Read MoreLanding Page Optimization Metrics, August 2013 [TABLE]
The greatest percentage considered conversion to be the most useful metric for analyzing the performance of their landing pages.
Read MoreEmail Click Frequency By Gender, August 2013 [CHART]
Consumers open emails throughout the day, but only click through those emails at specific preferred times, and those windows are often short.
Read MoreEmail Click-to-Open Rates By Industry, Q2 2012 [CHART]
49% of email opens happen on a mobile device.
Read More