Posts Tagged ‘Metrics’
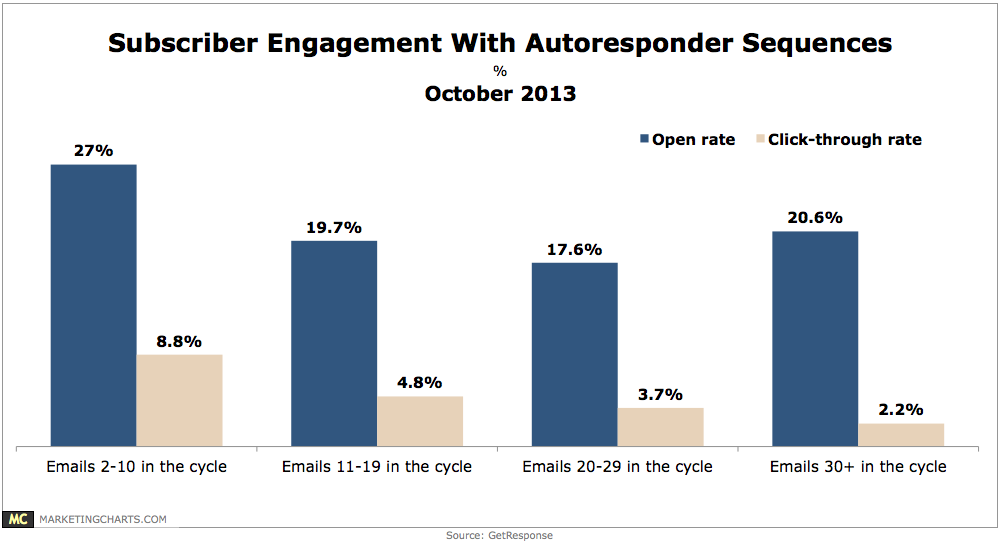
Subscriber Engagement With Autoresponder Sequences, October 2013 [CHART]
The average autoresponder sequence contains 8 emails and spans 49 days.
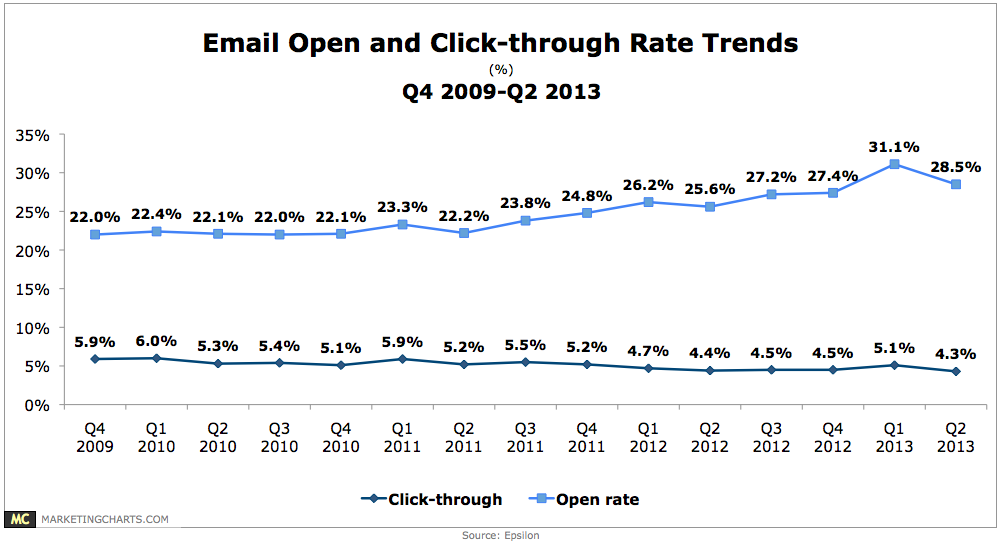
Read MoreEmail Open & Click-Through Rate Trends, Q4 2009 – Q2 2013 [CHART]
The average business-as-usual (BAU) email open rate in North America fell to 28.8% in Q2 after hitting a multi-quarter peak of 31.1% in Q1.
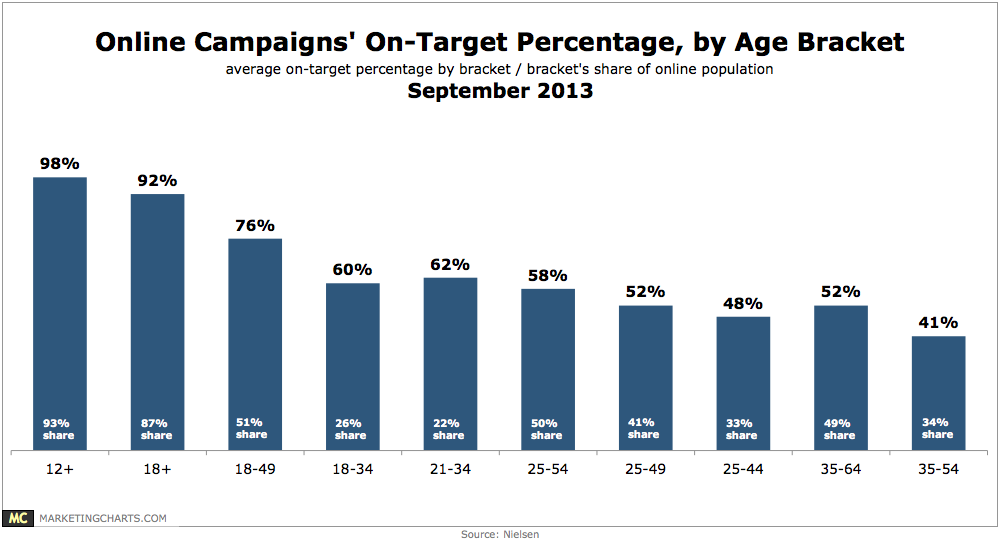
Read MoreOnline Targeting On-Target Percentages By Age, September 2013 [CHART]
Online campaigns appear to be having the most success reaching younger demographics, who are often the most coveted audiences.
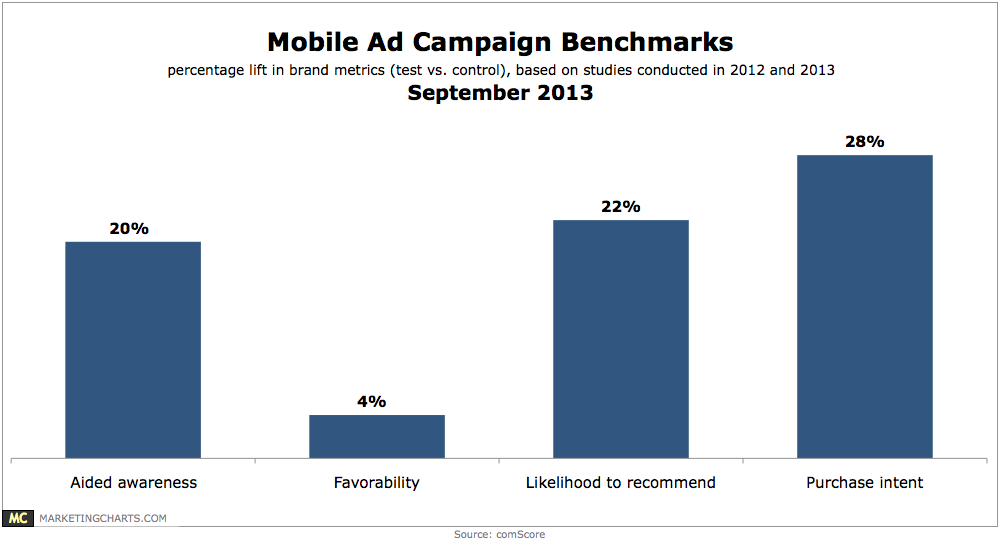
Read MoreMobile Advertising Benchmarks, September 2013 [CHART]
Mobile ads are indeed effective in influencing consumers’ brand perceptions.
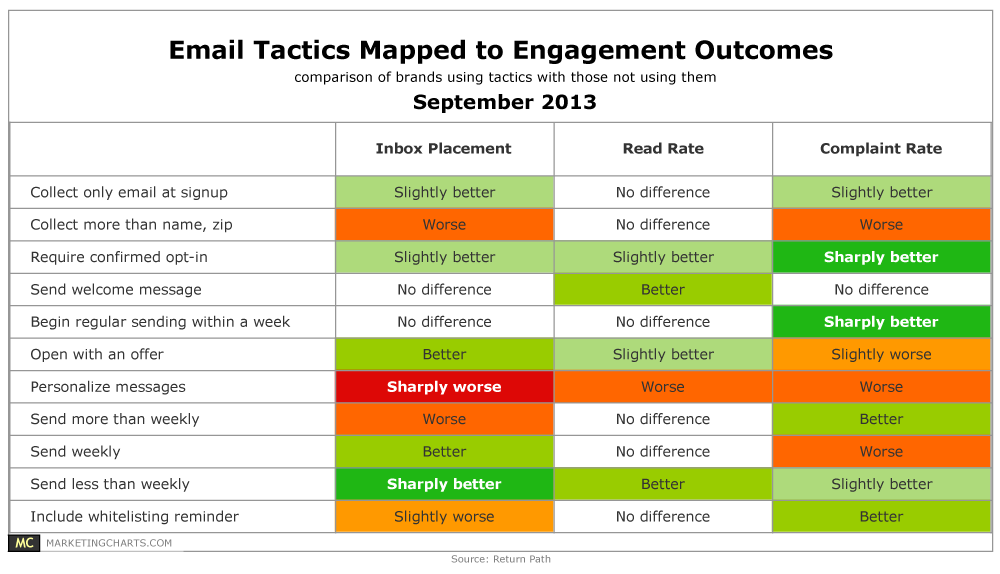
Read MoreEmail Tactics' Effectiveness On Engagement, September 2013 [TABLE]
Email practices – from signup to unsubscribe – have significantly changed over the past 5 years.
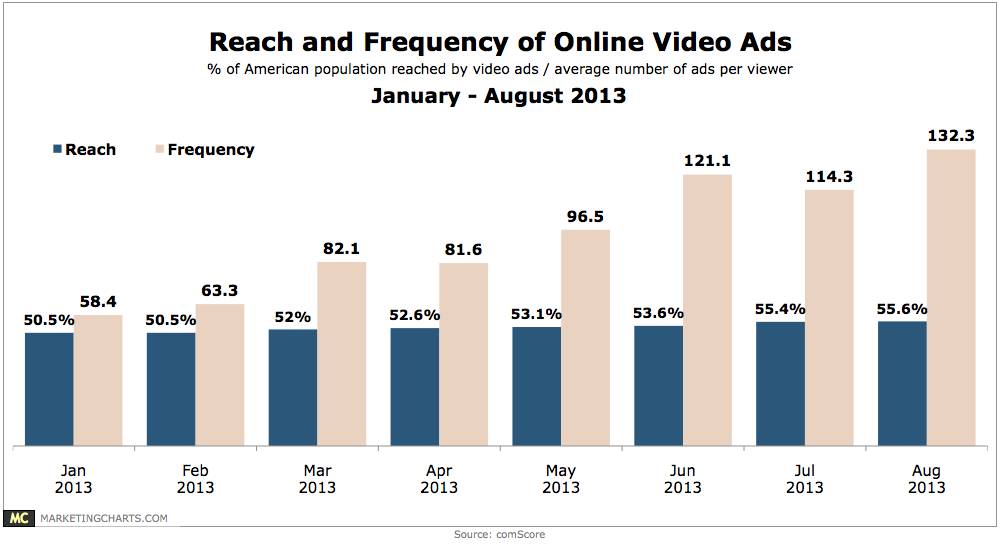
Read MoreReach & Frequency Of Video Ads, January – August 2013 [CHART]
In August, the average viewer saw 132 ads, besting the previous high of 121 set in June, and more than doubling January’s average of 58.
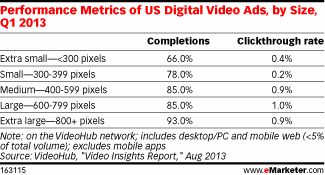
Read MoreOnline Video Ad Metrics By Size, Q1 2013 [TABLE]
The larger the video ad, the higher the completion rate, with a 93.0% completion rate for extra-large video ads vs. a 66.0% completion for extra-small video ads.
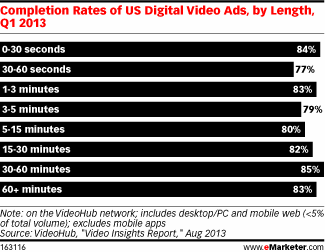
Read MoreVideo Ad Completion Rates By Length, Q1 2013 [CHART]
Completion rates were lowest for video ads that lasted between 30 to 60 seconds (77%), but ads that ran for 30 seconds or less saw an 84% completion rate.
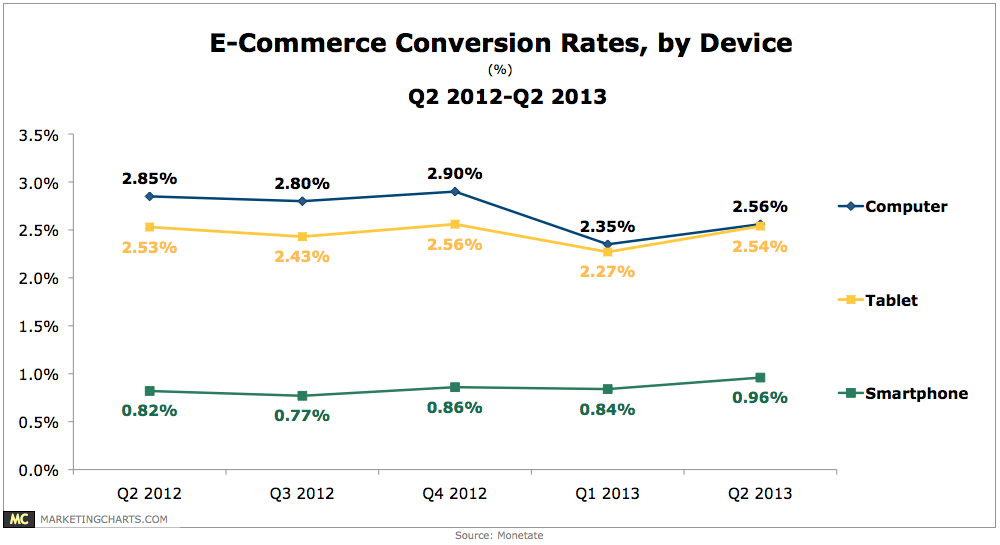
Read MoreeCommerce Conversion Rates By Device, Q2 2012 – Q2 2013 [CHART]
During the second quarter of the year, tablet traffic converted as well as traffic from traditional computers, while maintaining a similar average order value.
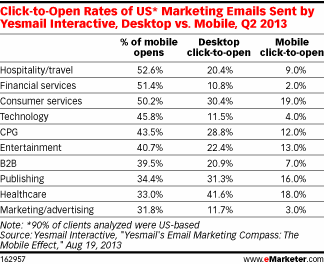
Read MoreMarketing Email Click-To-Open Rates By Industry & Platform, Q2 2013 [TABLE]
While readers clicked on 23% of emails opened on desktop in Q2 2013 in the US, only 11% did so for emails on mobile.
Read More