Posts Tagged ‘Metrics’
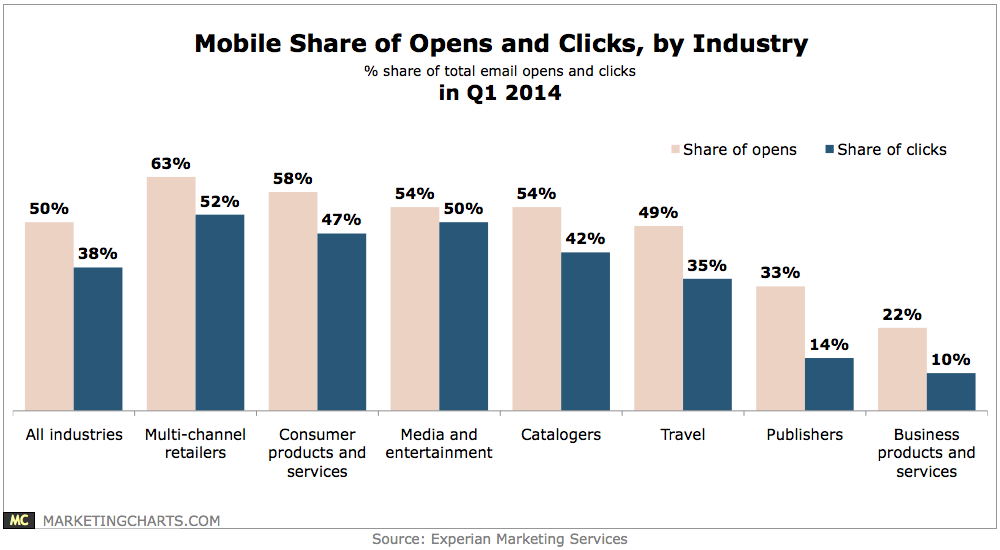
Mobile Email Benchmarks By Industry, Q1 2014 [CHART]
Half of total email opens occurred on a mobile device in Q1 2014.
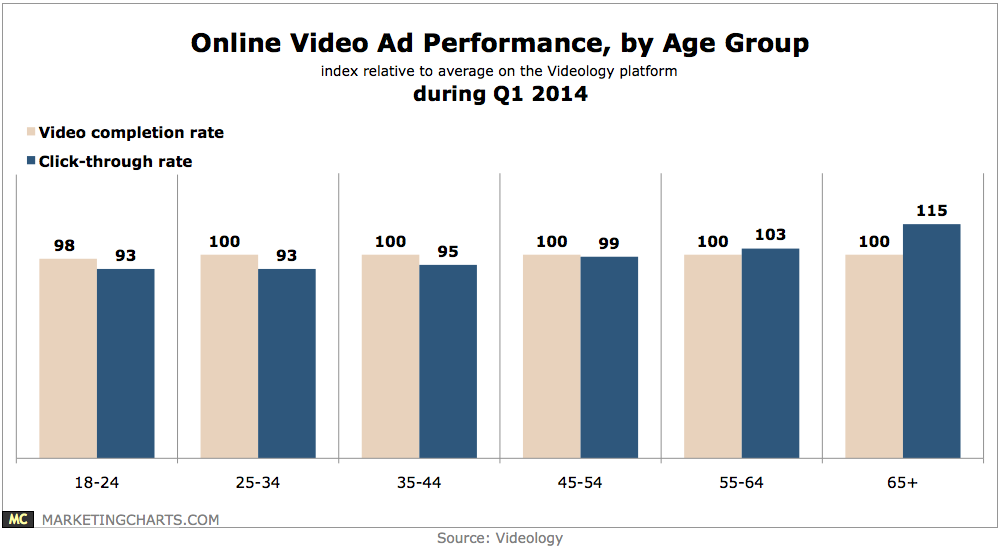
Read MoreOnline Video Ad Performance By Age, Q1 2014 [CHART]
Older viewers were more likely to click on video ads than their younger counterparts in Q1.
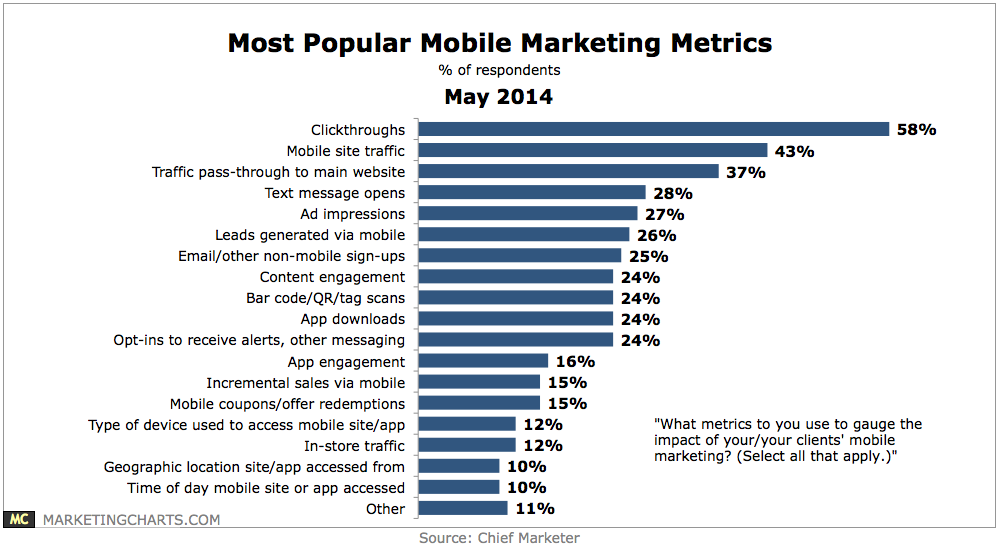
Read MoreTop Mobile Marketing Metrics, May 2014 [CHART]
While only 31% of marketers and agencies ran campaigns or promotions directed at mobile users last year, a slight majority 52% plan to run campaigns specific to mobile users this year.
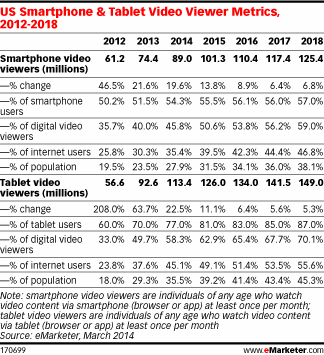
Read MoreUS Mobile Video Viewer Metrics, 2012-2018 [TABLE]
Nearly half of the US population will use a tablet at least monthly in 2014.
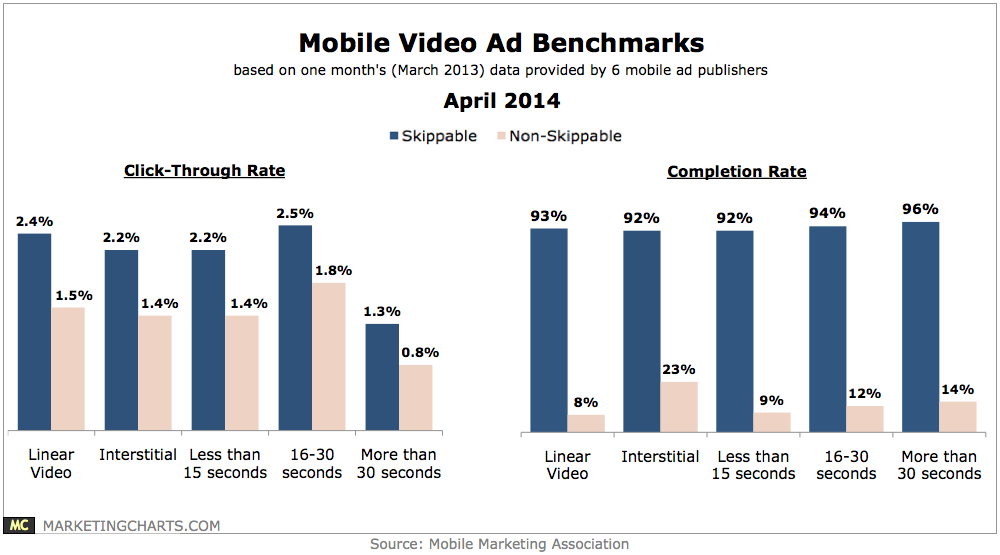
Read MoreMobile Video Ad Benchmarks By Length & Format, April 2014 [CHART]
Completion rates for non-skippable video ads topped 90% for each of the formats measured – linear video (93%); interstitial (92%); and value exchange (97%).
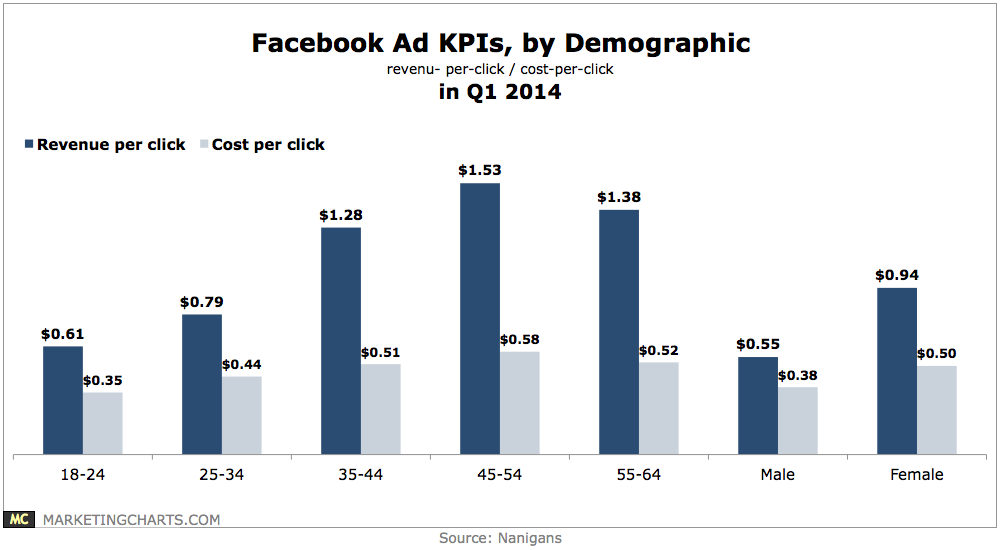
Read MoreFacebook Ad KPIs By Demographic, Q1 2014 [CHART]
Roughly one-quarter of ad spending aimed at Facebook users aged 18-64 was directed to the 18-24 bracket in Q1.
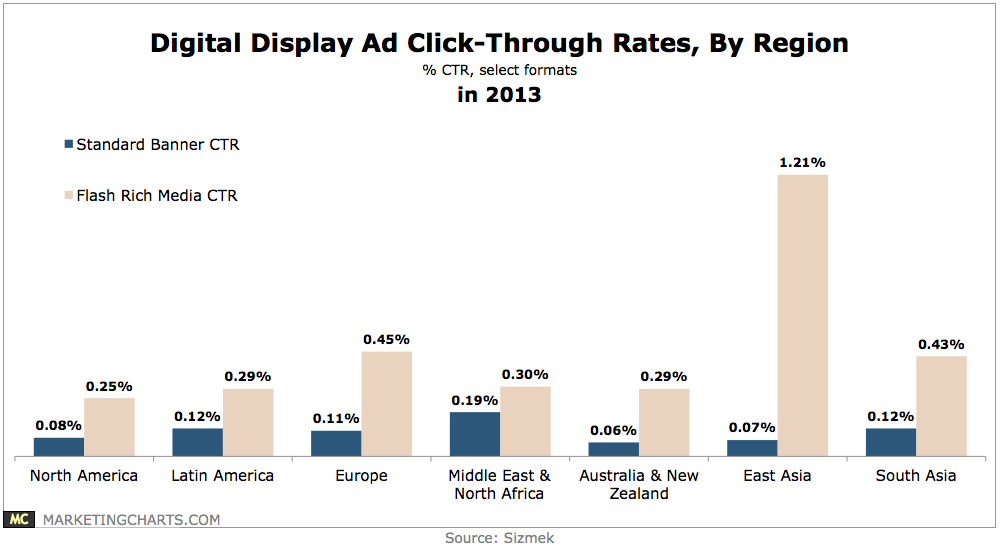
Read MoreOnline Display Ad Benchmarks By Region in 2013 [CHART]
In North America, the average click-through rate (CTR) for standard banners slipped from 0.1% to 0.08%, while flash rich media CTRs jumped from 0.14% to 0.25%.
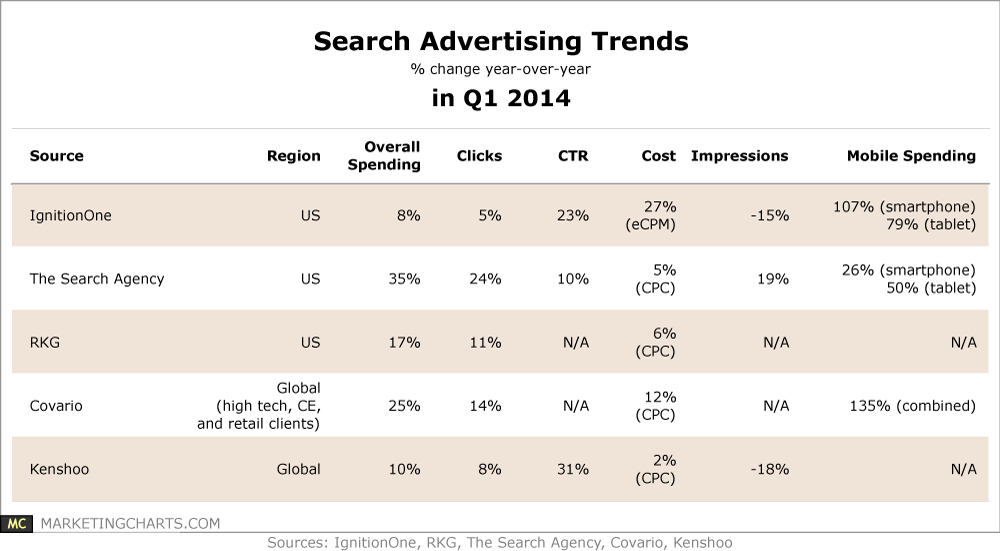
Read MoreSearch Advertising Trends, Q1 2014 [TABLE]
Spending is up (particularly on mobile), as are click-through rates.
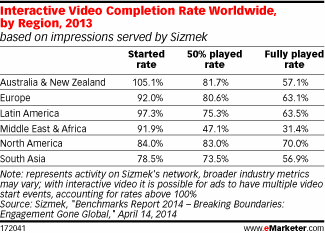
Read MoreInteractive Video Completion Rates Worldwide By Region, 2013 [TABLE]
While clickthrough rates for such ads in 2013 were much lower than those for HTML5 polite video and in-stream video, at 0.17%, 0.39% and 0.60%, respectively, interactive videos did just what they set out to do: Engage those who did view them.
Read MoreGrowth In TV-Related Queries On Google & YouTube, 2012 vs 2013 [CHART]
TV-related searches on YouTube were up 54% during May-December 2013 over the comparable year-earlier period.
Read More