Posts Tagged ‘Metrics’
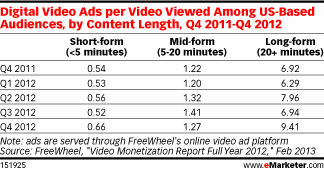
Video Ad View Rates, Q4 2011 – Q4 2012 [TABLE]
Total video views among internet users in the US were up 23% year over year in Q4 2012.
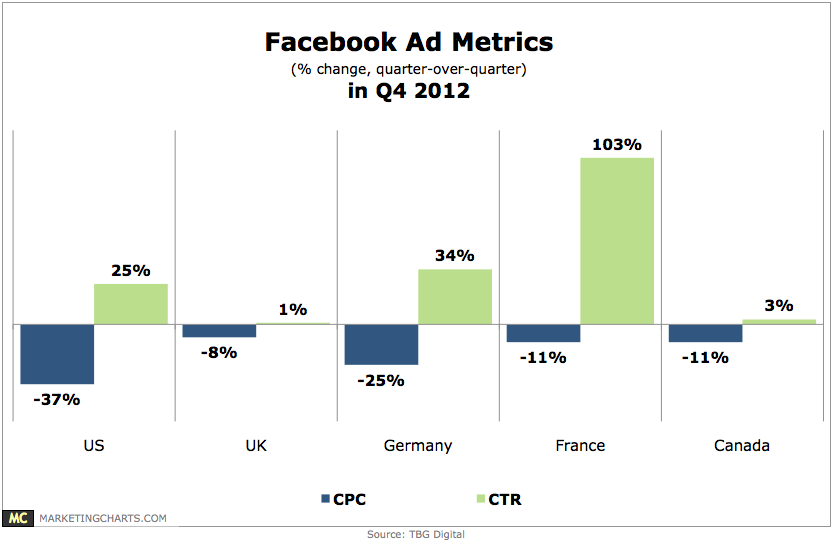
Read MoreFacebook Ad Metrics, Q4 2012 [CHART]
After falling by 40% between Q2 and Q3, the cost of advertising on Facebook in the US dropped by another 37% in Q4.
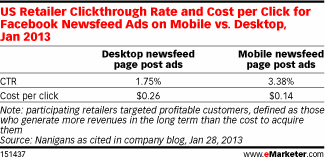
Read MoreUS Retail Facebook Newsfeed Ad CTR & CPC For Mobile vs. Desktop, January 2013 [TABLE]
Mobile newsfeed ads achieved a considerable clickthrough rate of 3.38%.
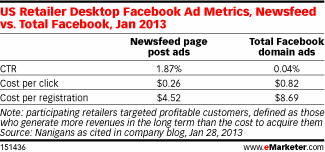
Read MoreUS Retailer Desktop Facebook Newsfeed Ad Metrics, January 2013 [TABLE]
While ads in the sidebar performed poorly, garnering only a 0.04% clickthrough rate among high-value Facebook users, page post ads in the newsfeed saw a clickthrough rate more than 46 times higher, at 1.87%.
Read MoreDetermining The ROI Of Facebook & Twitter [INFOGRAPHIC]
This infographic from InventHelp illustrates how to determine the ROI of Facebook & Twitter.
Read MoreBenchmark Email Response Metrics, January-November 2012 [CHART]
Customers in the Asia-Pacific region (APAC) enjoyed much higher click and open rates during 2012 than its customers in Europe and North America.
Read MoreB2B Marketing Measurement [INFOGRAPHIC]
This infographic by eloqua takes a look at the state of B2B marketing measurement.
Read MoreB2B Marketing Targets & Lead Scoring, December 2012 [CHART]
Named accounts scored highly in importance, but fared worse in budget allocation, and was last in lead scoring consideration.
Read MoreMarketing Attribution Use, November 2012 [CHART]
26% of clients and 36% of agencies surveyed from around the world report that they (or their clients) typically carry out marketing attribution.
Read MoreMost Successful Brand Video Metrics, 2011 & 2012 [CHART]
Brand lift is the most important video metric that delivered the highest level of success by the most respondents (54%).
Read More


