Posts Tagged ‘Metrics’
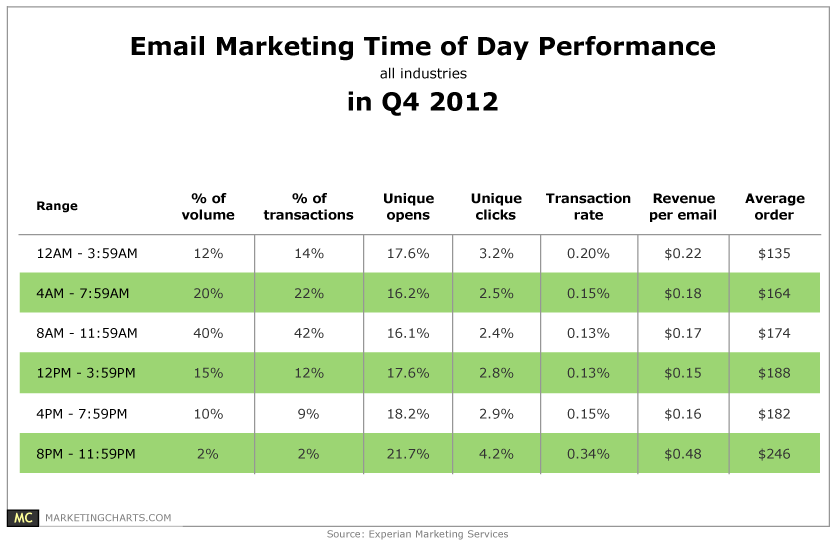
Email Marketing Performance By Daypart, Q4 2012 [TABLE]
A plurality 40% of emails were sent between 8 AM and 11:59 AM, with that time frame accounting for 42% of transactions.
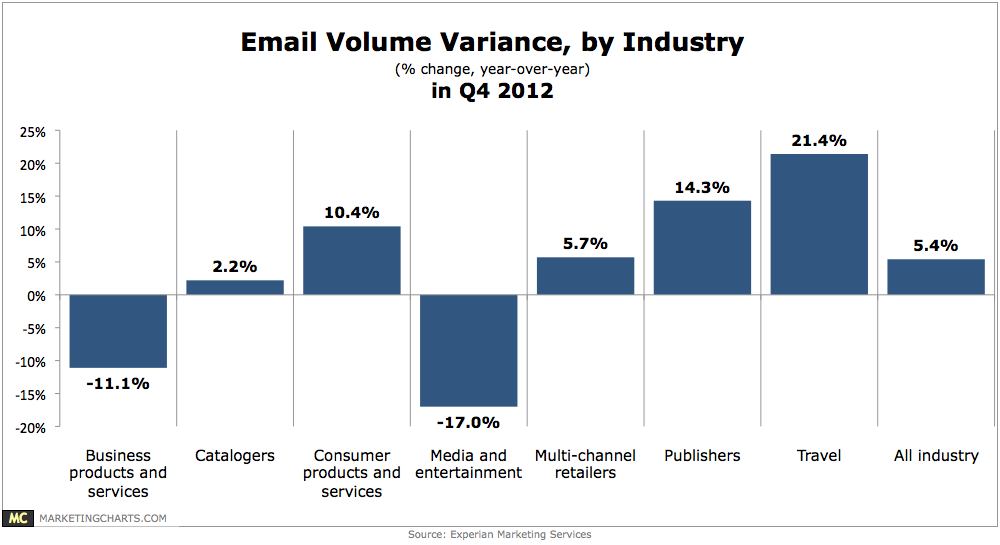
Read MoreEmail Volume Variance By Industry, Q4 2012 [CHART]
Email volume rose 5.4% year-over-year in Q4.
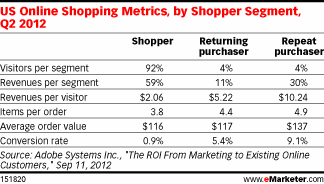
Read MoreOnline Shopping Metrics By Shopper Segment, Q2 2012 [TABLE]
Even though return purchasers and repeat purchasers accounted for only 8% of site visitors, they generated a disproportionately high 41% of site sales.
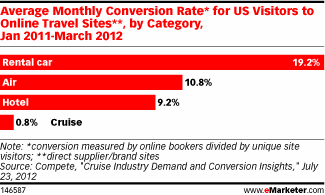
Read MoreConversion Rates For American Visitors To Travel Websites By Category, January 2011 – March 2012 [CHART]
The monthly average for conversions via cruise sites was less than 1% between January 2011 and March 2012.
Read MoreFactors Contributing To Inbound Marketing Success, February 2013 [CHART]
HubSpot has found that virtually all of its customers experienced an increase in traffic since using HubSpot, with a plurality (25.1%) attributing that increase to blogging.
Read MoreTop Metrics For Evaluating Influencers, December 2012 [CHART]
Facebook friends and Likes and Twitter followers were among the most important metrics used by brands when evaluating these individuals.
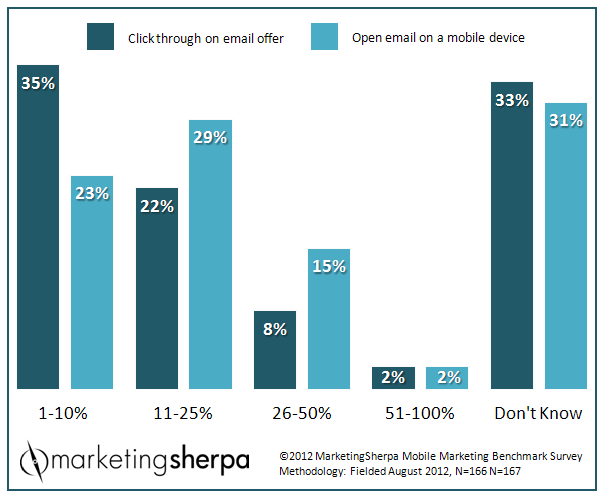
Read MoreMarketers' Knowledge Of Mobile Email Metrics, August 2012 [CHART]
31% of email marketers do not know their mobile email open rate.
Read MoreFacebook Pages Benchmarks [INFOGRAPHIC]
This infographic by Quintly analyzes Facebook metrics to provide benchmarks for pages of all sizes.
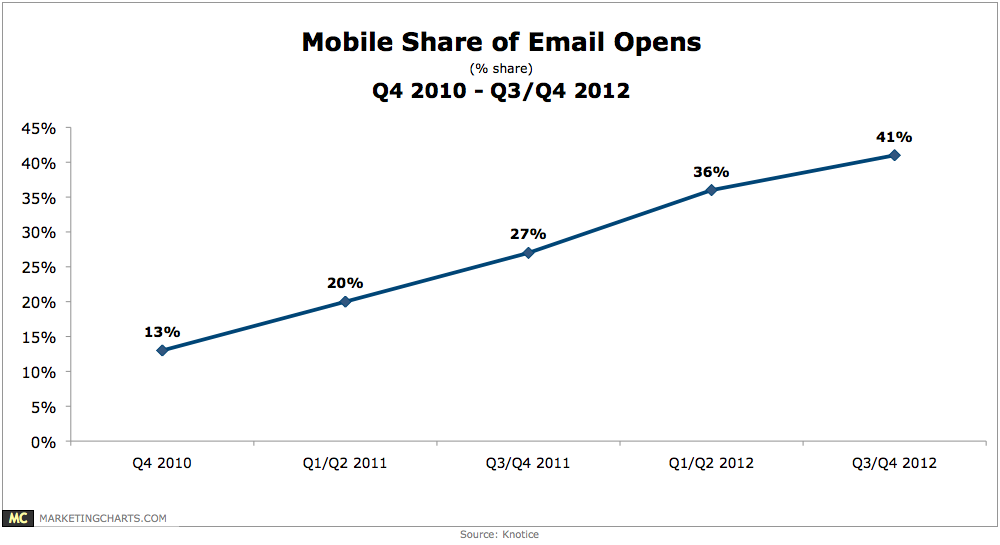
Read MoreMobile Email Opens, 2010-2012 [CHART]
The share of email opens occurring on a mobile device keeps growing, climbing to 41% in the second half (H2) of 2012 from 36% in H1.
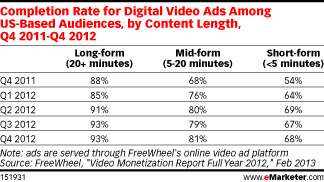
Read MoreVideo Ad Completion Rates, Q4 2011 – Q4 2012 [TABLE]
Ad completion rates were highest for long videos in Q4 2012 at 93%, compared with 81% for mid-form videos and 68% for short-form videos.
Read More