Posts Tagged ‘Media Marketing’
Time Spent On iOS & Android Devices By Activity, April 2013 [CHART]
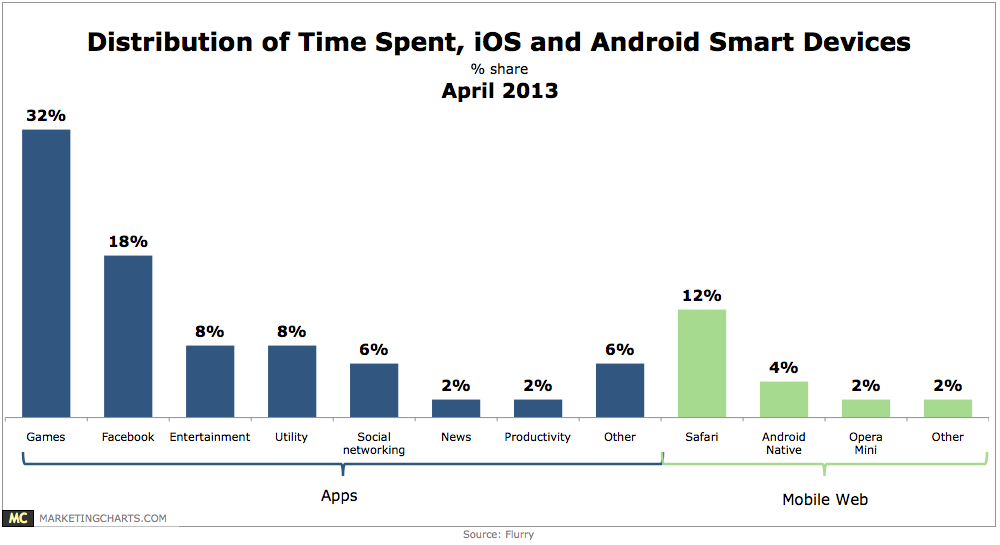
Android and iOS smart phone and tablet users spend an average of 2 hours and 38 minutes per day on their devices.
Read MoreAmericans' Daily Media Consumption, 2012 vs 2013 [CHART]
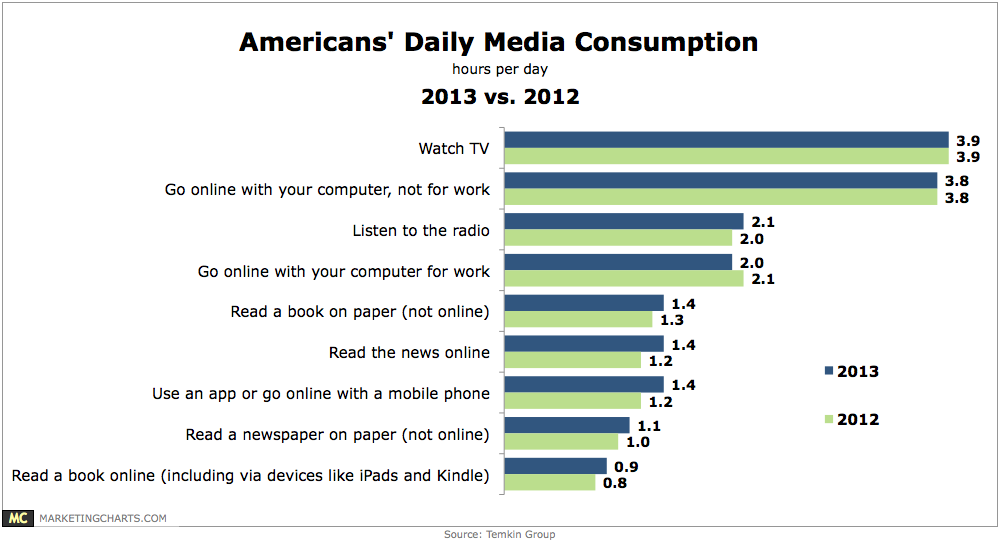
Americans are holding steady in terms of their TV consumption and non-work-related internet use, but are spending more time with other activities such as reading books and accessing the internet via a mobile device.
Read MoreGlobal Mobile Ad Spending Share By Vertical, Q4 2012 [CHART]
The worst performers on tablets vs. smart phones were the fast-moving consumer goods and retail industry, along with the social and dating category.
Read MoreTablet Ad Click-Through Rate Uplift By Industry, December 2012 [CHART]
Click-through rates for entertainment and media, as well as the travel category rose by 81% and 66%, respectively.
Read MoreGoogle Universal Search Results By Content Type, 2012 [CHART]

A new study show the visibility of Google Shopping in Google’s Universal Search results dropped significantly after the search engine implemented a new paid inclusion model.
Read MoreGoogle's Universal Search [INFOGRAPHIC]
This infographic from Search Metrics illustrates their study of Google’s Universal Search results.
Read MoreTablet Traffic To US Websites Of Select Industries, January 2013 [CHART]
The top-performing retailer site studied got 13% of internet traffic from tablets.
Read MoreUS Smart Phone Website Traffic To Select Industry Websites, January 2013 [CHART]
The top-performing site that got the greatest share of traffic from smart phones was in the media and entertainment category.
Read MoreTime Spent On US Websites By Select Industries, January 2013 [CHART]
The top-performing media and entertainment site kept users on the site for about 12 minutes per visit.
Read MoreAverage Marketing Budget Growth In 2013 For Select US Industries [CHART]
For 2013, marketers are expecting to increase overall marketing budgets by an average of 6%.
Read More