Posts Tagged ‘Media Marketing’
Products Researched & Purchased On A Tablet, March 2012 [TABLE]
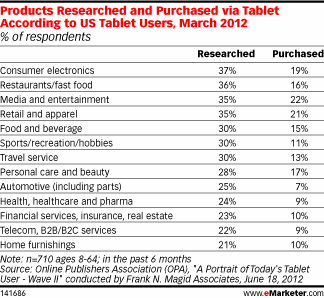
A survey from the Online Publishers Association compared product research with product purchase by category among tablet users in March 2013.
Read MorePreferred Television Genres By Viewing Device, June 2013 [CHART]
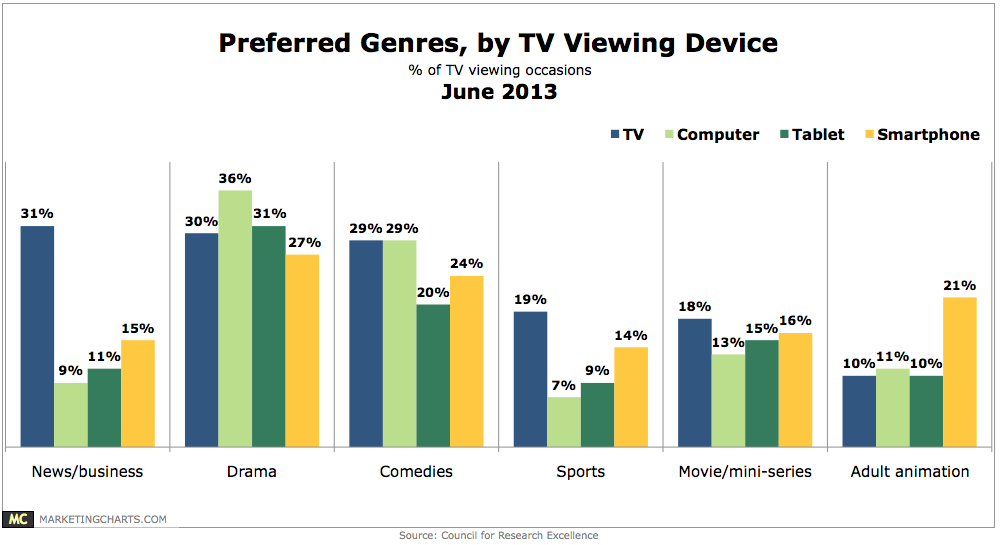
On the traditional TV, news and business (31%) got the edge on drama (30%) and comedies (29%) as the top genres by percentage of viewing occasions.
Read MoreUS Online Ad Spending Growth By Industry, 2011-2017 [TABLE]
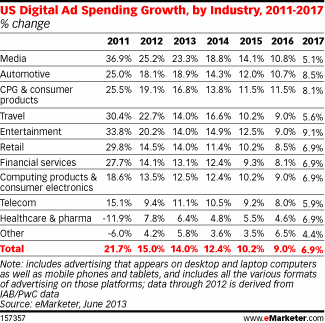
Four of the six industries growing their digital ad spending at or above overall market rates are retail, financial services, consumer packaged goods & travel.
Read MoreCustomer Satisfaction With Online Interactions By Industry Segment, June 2013 [CHART]
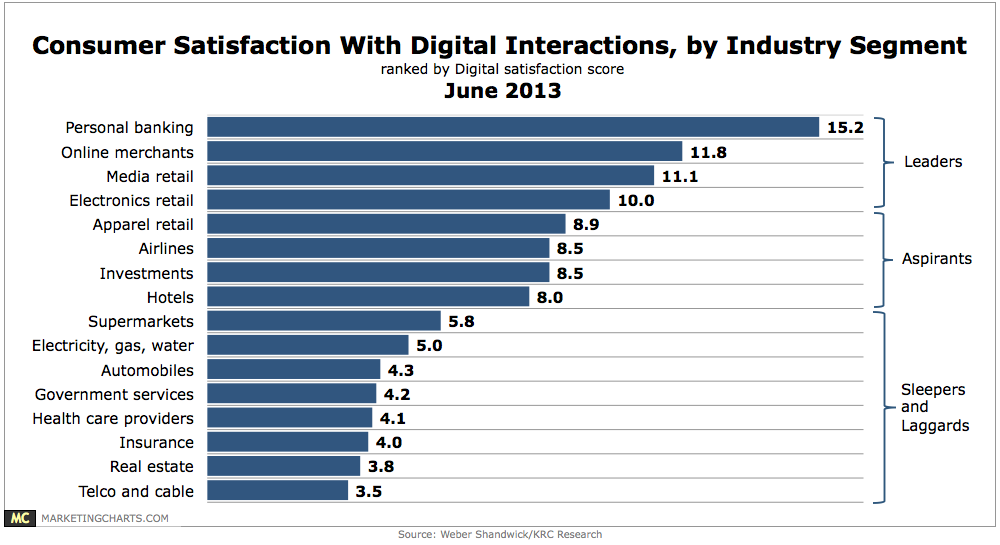
E-commerce sites exceeded the threshold of excellence in customer satisfaction last year, according to the American Customer Satisfaction Index.
Read MoreIndustries & Products For Which People Have Written Post-Purchase Online Reviews, October 2012 [TABLE]
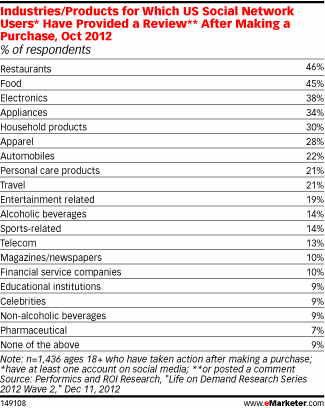
Among social network users who took a post-purchase action online, 22% reported posting a review or other comment after an automobile purchase.
Read MoreGlobal Ad Spending Growth By Sector, 2012 [CHART]
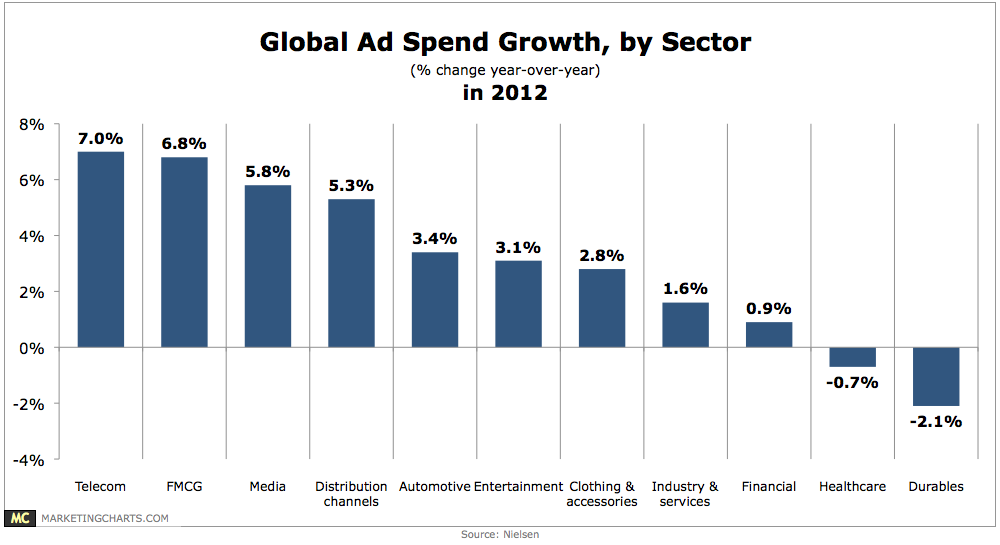
Global ad spending grew by 3.2% last year, but some sectors fared better than others.
Read MoreSenior Execs' Use Of Mobile, April 2013 [CHART]
Tablet adoption in particular has jumped, doubling in a year to 6 in 10 respondents, with use growing across all age groups.
Read MoreTime Spent Online By Activity, 2011 & 2012 [TABLE]
On the desktop internet, activity was much more heavily weighted toward social networking, which accounted for 27% of time spent online.
Read MoreTime Spent On Mobile Device Online By Activity, Q1 2013 [TABLE]
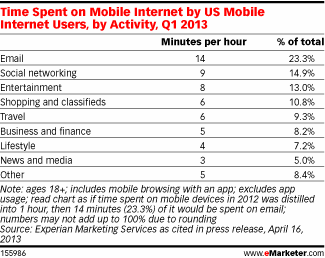
US mobile internet users spent the greatest percentage of their mobile web time using email, a 23% share of time spent vs. only 5% of time spent on desktop.
Read MoreShare Of Americans' Time Online By Category, 2011 vs 2012 [CHART]
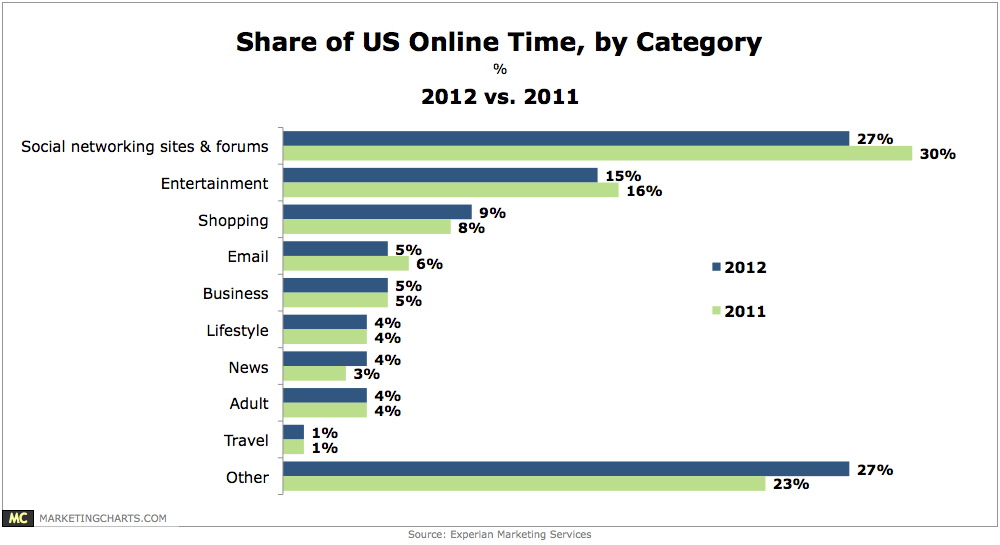
27% of Americans’ time spent online last year was spent accessing social networking sites and forums.
Read More