Posts Tagged ‘Media Marketing’
B2B Media Industry Revenues, 2008-2013 [CHART]
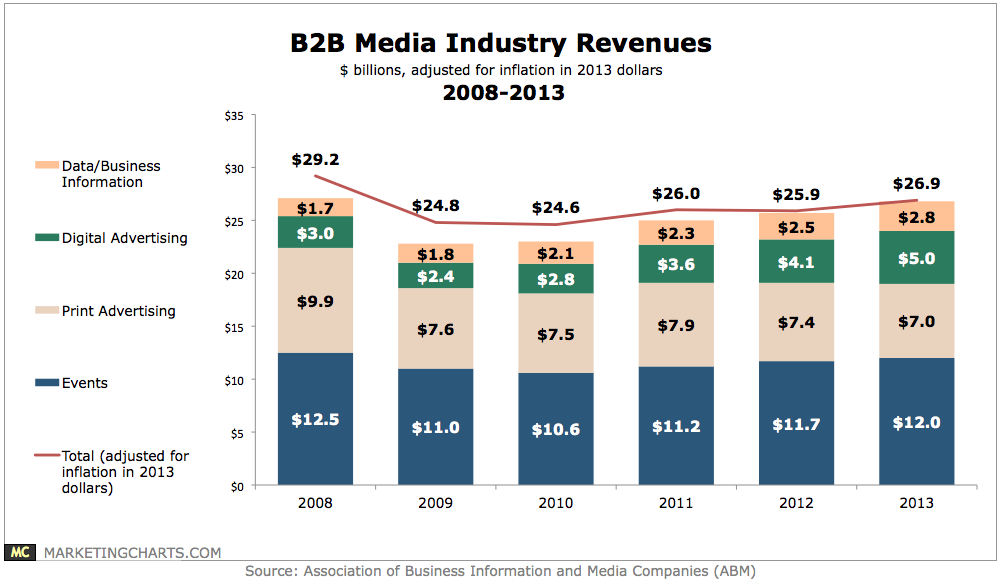
Industry revenues grew by 4.8% year-over-year (3.8% when adjusted for inflation) to reach $26.9 billion, the highest total since 2008 ($29.2 billion, adjusted for inflation in 2013 dollars).
Read MoreAmericans' Time Spent On Mobile Internet By Category, Q1 2014 [TABLE]
When it comes to time spent using the mobile internet, apps continue to grab an overwhelming majority of US consumers’ time.
Read MoreAmericans' Small-Ticket Purchase Cutbacks, April 2014 [CHART]
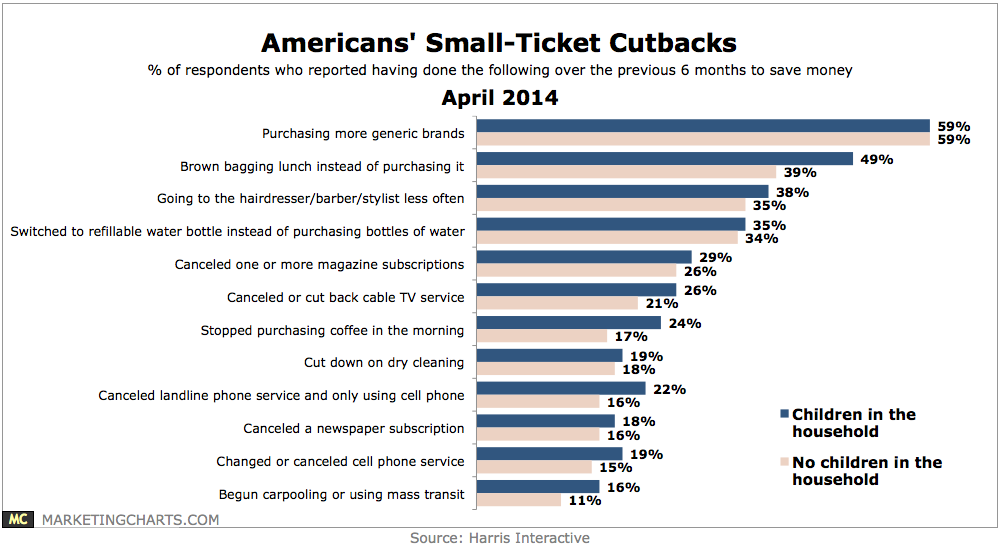
Parents are also more likely than those without children in the household to decrease their spending in a variety of areas, including restaurants (64% vs. 56%) and entertainment (60% vs. 51%).
Read MoreAmericans' Paid News Subscriptions, February 2014 [CHART]
Just one-quarter of US consumers said that they currently paid for at least one news subscription.
Read MorePreferred News App Content, Smart Phone vs Tablet, December 2013 [CHART]
Getting breaking news via smartphone apps was far more popular than on tablets, likely due to the former being more portable.
Read MoreMost Important News Category For Mobile News App Users, December 2013 [CHART]
42% of US mobile news app users said that breaking news was the most important news app category.
Read MoreMedia Gender Gap [INFOGRAPHIC]
Male journalists make up 63% of bylines in print, Internet and wire news media, according to a recent report from the Women’s Media Center.
Read MoreUS News Media Revenue Sources In 2013 [CHART]
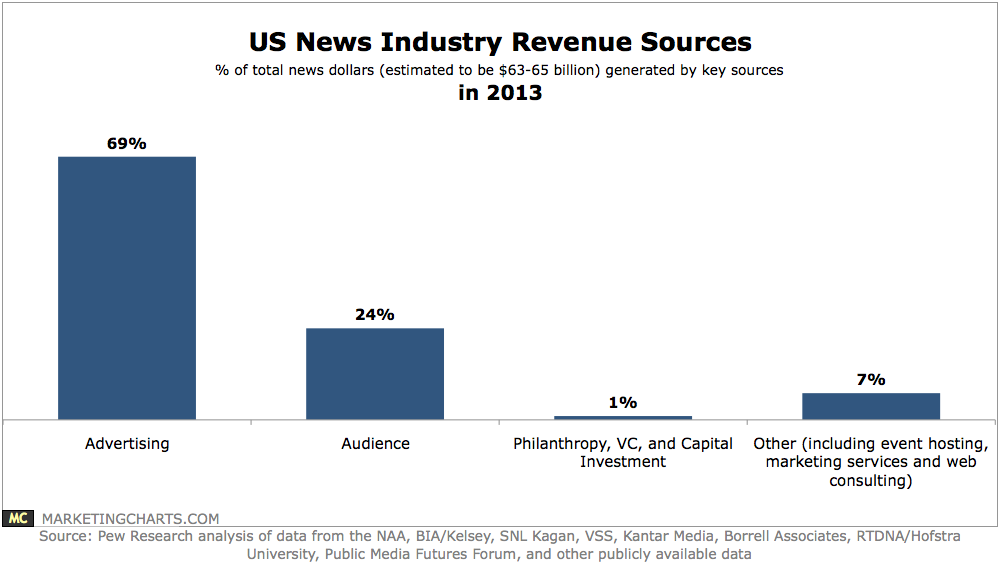
The US news industry generates somewhere between $63 and $65 billion in annual revenues compared to Google’s $58 billion revenues.
Read MoreUK Twitter Users' Engagement With News Brands, December 2013 [CHART]
60% of UK Twitter users agreed that the social platform allowed them to engage with newspaper brands that they wouldn’t normally read in print format.
Read MoreTop Industries By Branded Video Views Worldwide, 2013 [TABLE]
The consumer packaged goods industry saw the most video ad views, with over 2.22 billion.
Read More