Posts Tagged ‘mCommerce’
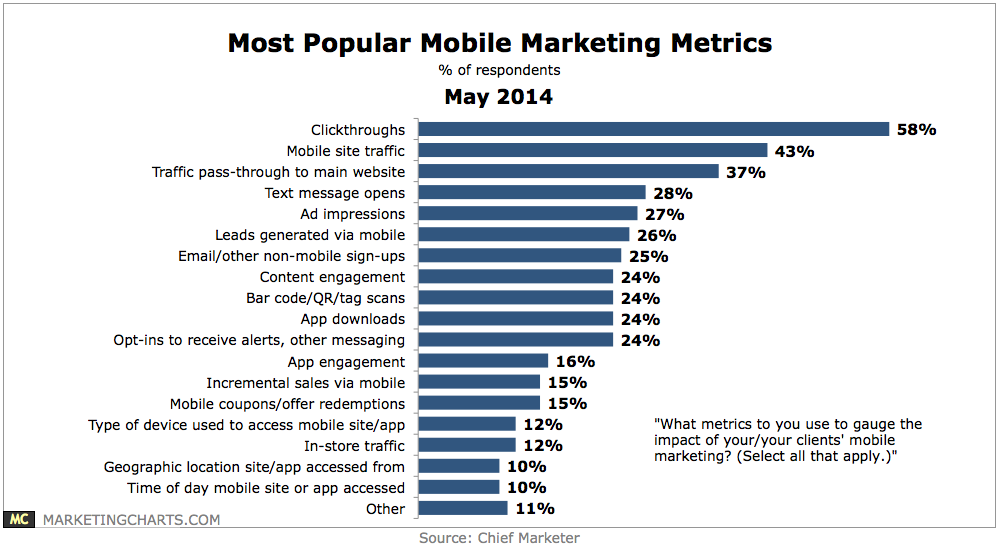
Top Mobile Marketing Metrics, May 2014 [CHART]
While only 31% of marketers and agencies ran campaigns or promotions directed at mobile users last year, a slight majority 52% plan to run campaigns specific to mobile users this year.
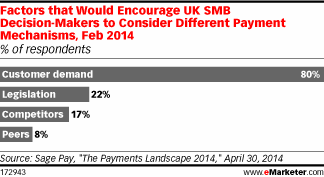
Read MoreFactors That Would Encourage UK SMBs To Different Payment Mechanisms, February 2014 [CHART]
80% of United Kindom SMB decision-makers would consider different payment mechanisms based on customer demand.
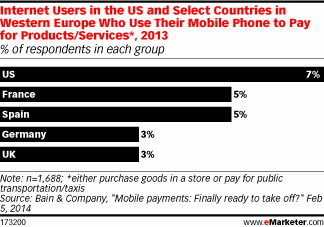
Read MoreMobile Payment Consumers By Select Countries, 2013 [CHART]
55% of UK internet users knew of mobile payments, but only 3% actually used their mobile phones to pay for transportation or goods in-store.
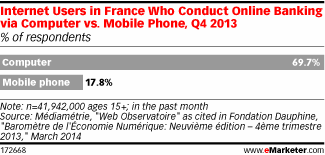
Read MoreFrench Consumers Who Bank Online, Computer vs Mobile, Q4 2013 [CHART]
Nearly seven in 10 French web users ages 15 and older said they had carried out at least one banking activity on a computer at home in the month before Q4 2013 polling.
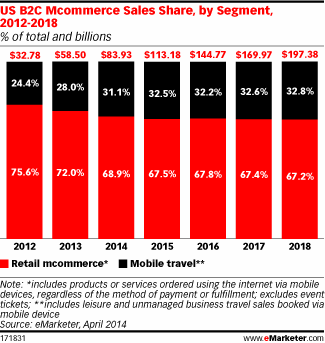
Read MoreUS B2C mCommerce Sales Share By Segment, 2012-2018 [CHART]
In 2013, travel totaled 34.1% of the nearly $400 billion US eCommerce market.
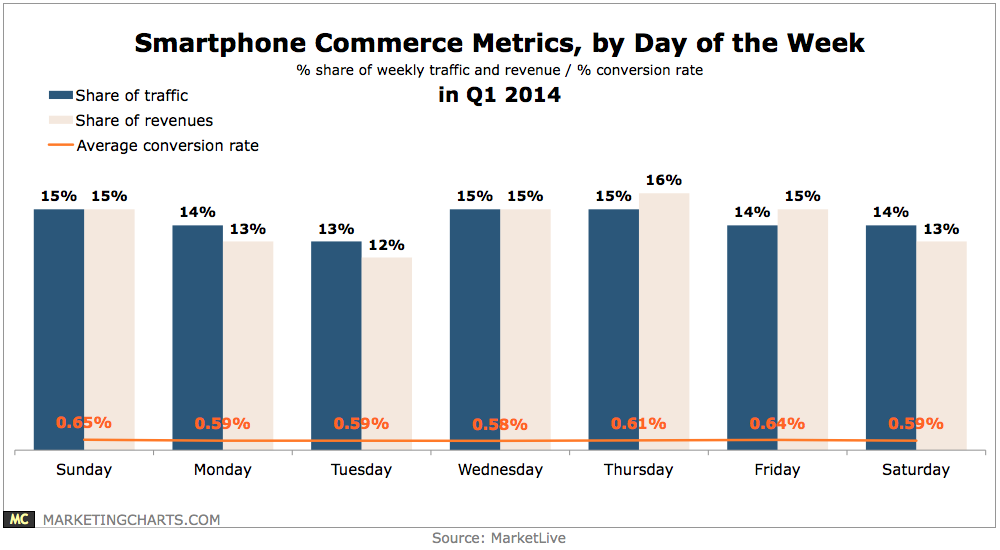
Read MoreSmart Phone Commerce Metrics By Day Of The Week, Q1 2014 [CHART]
Mondays and Saturdays tied for the second-largest share of weekly revenues (15% each).
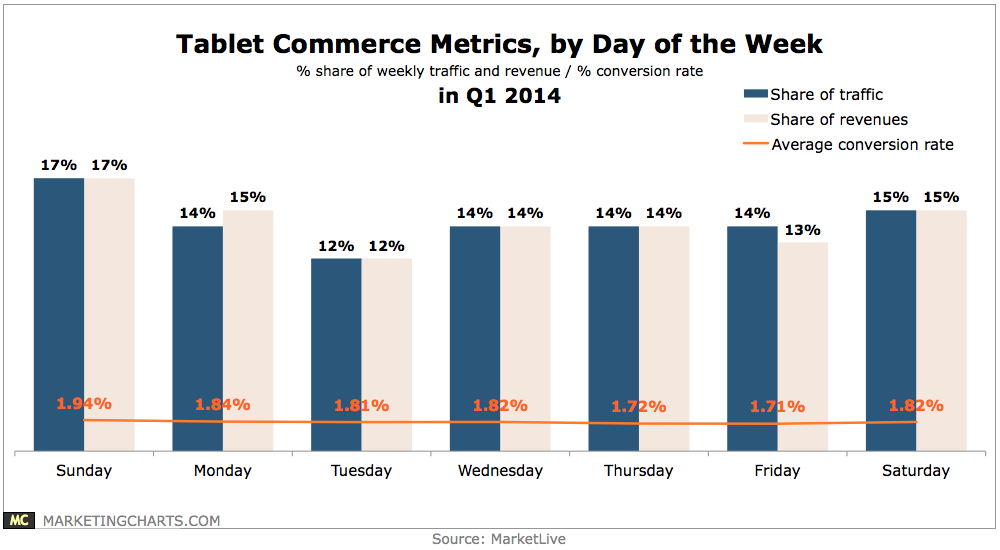
Read MoreTablet Commerce Metrics By Day Of The Week, Q1 2014 [CHART]
Mobile accounted for 10.5% of retail e-commerce spending last year.
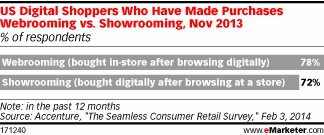
Read MoreWebrooming vs Showrooming, November 2013 [CHART]
78% of respondents reported Webrooming, or researching online before heading to a store to make a purchase.
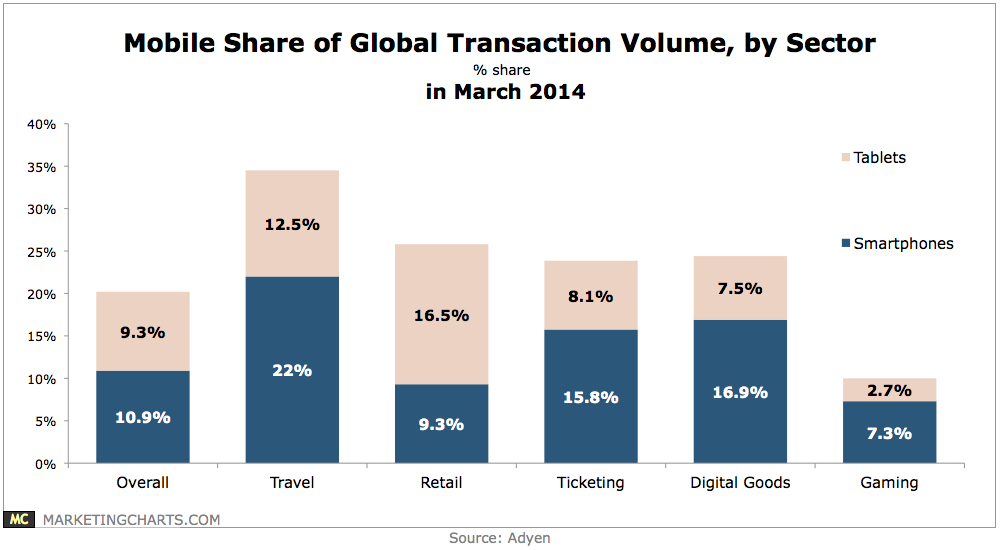
Read MoreMobile Share Of Global Transaction Volume By Sector, March 2014 [CHART]
Smart phones (10.9%) and tablets (9.3%) together accounted for more than 1 in 5 payment transactions globally in March.
Read MoreAmericans Who Abandoned An In-Store Purchase As A Result Of Mobile Use, January 2014 [CHART]
Nearly two-thirds of Gen Xers and Yers said they had decided not to make an in-store purchase based on information they found via smartphone.
Read More