Posts Tagged ‘Laptops’
Popular Features Of Local Business Search Sites By Device, December 2012 [TABLE]
Around 77% of those who conducted a local search on either a mobile phone or tablet went on to make a purchase either in-store, online or over the phone.
Read MoreDevices Used By Stage Of Local Business Searches, December 2012 [CHART]
Where mobile phones and tablets really showed their specific utility was in the share of local searches that ended on the devices—18% for each, compared with 4% of PC searches.
Read MoreDevices Use For Multitainment, 2012 vs 2013 [CHART]
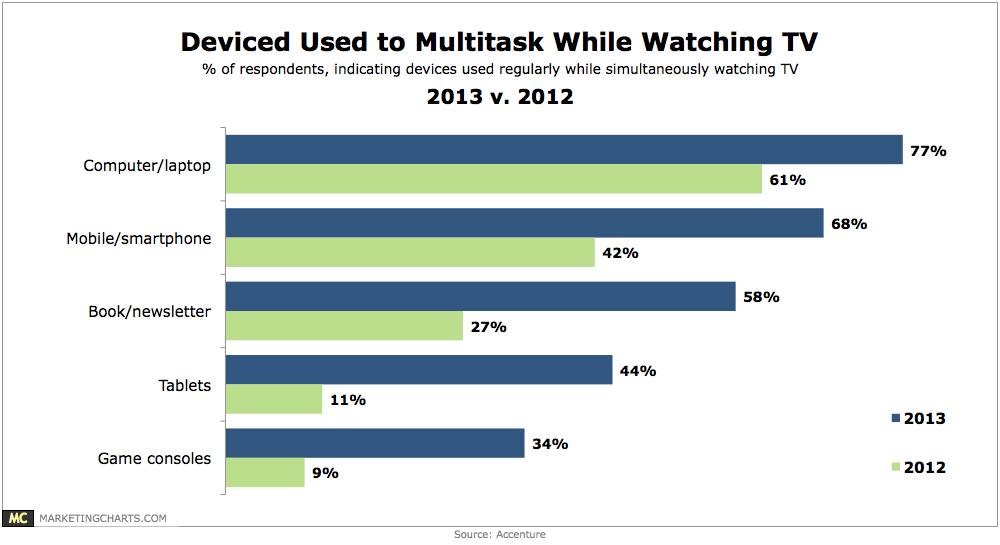
Regular use of tablets while watching TV (on a TV set) has soared from 11% in 2012 to 44% this year.
Read MoreWhere People Consume Text & Video Content, March 2013 [CHART]
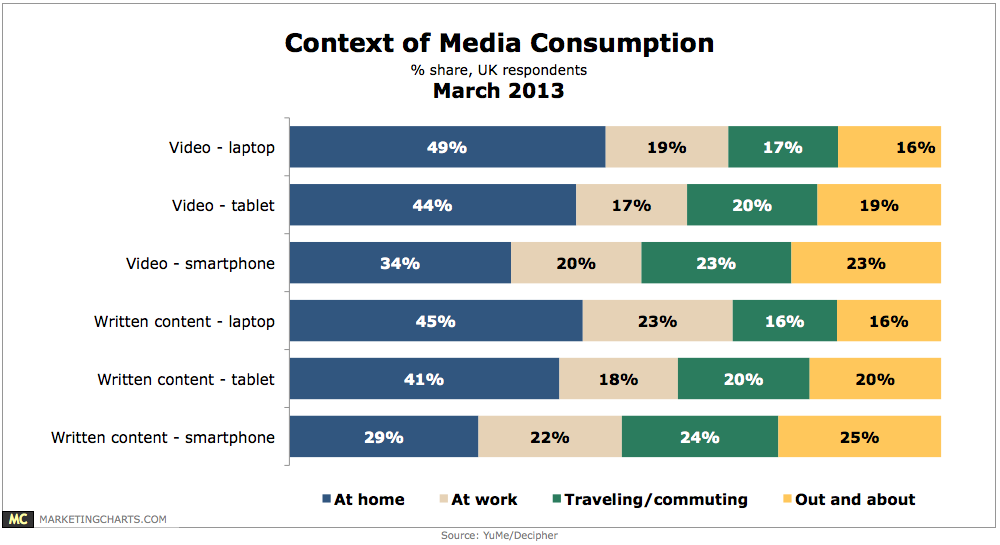
Regardless of device, consumption of videos takes place most often in the home and users are both more relaxed and explorative while at home.
Read MoreLocal Business Searches Resulting In Purchase By Device, March 2013 [CHART]
Almost 86 million people use their mobile phones to seek local business information in the US.
Read MoreNews Consumption Time By Device, March 2013 [CHART]
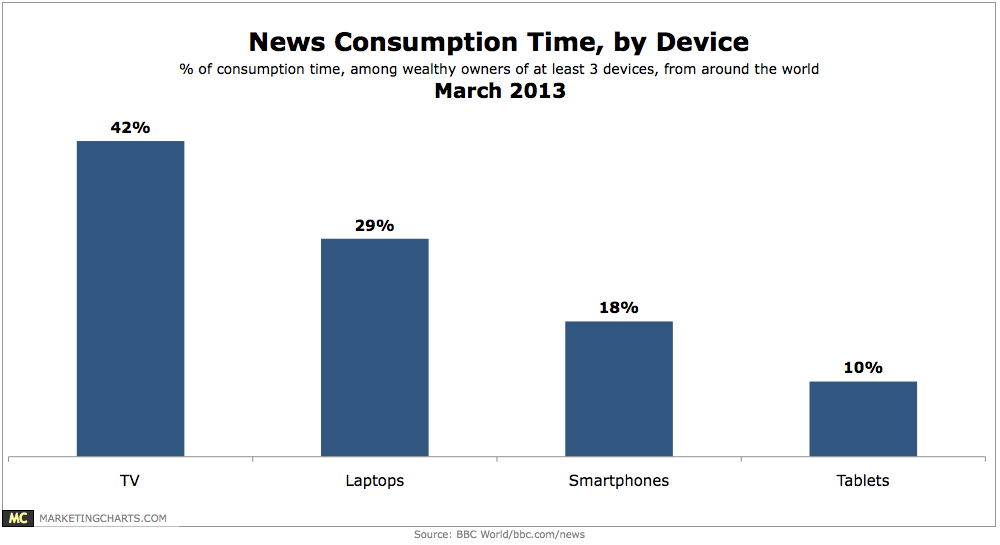
TV is still the primary device for news consumption, at 42% of respondents’ time, compared to 29% for laptops, 18% for smartphones, and 10% for tablets.
Read MoreAmerican Device Ownership, 2011 vs 2012 [CHART]

The rapid increase in smart device penetration in the US means that 26% of Americans surveyed late last year reported owning a laptop, smartphone and tablet, up from 10% in 2011.
Read MoreActivities Performed On Computers vs. Tablets vs. Smart Phones [CHART]
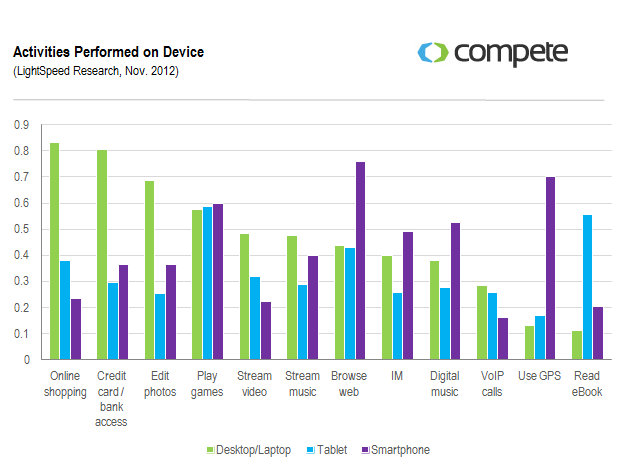
45% of consumers who use their mobile devices to shop report using the device to compare prices.
Read MorePreferences For Subscription vs. Ad-Supported Streaming Content By Device, November 2012 [CHART]

Most consumers still prefer free, ad-supported content though those with connected TVs are more likely to like the ad-free subscription model.
Read MoreOnline Videos Views By Device, Q4 2011 – Q4 2012 [CHART]
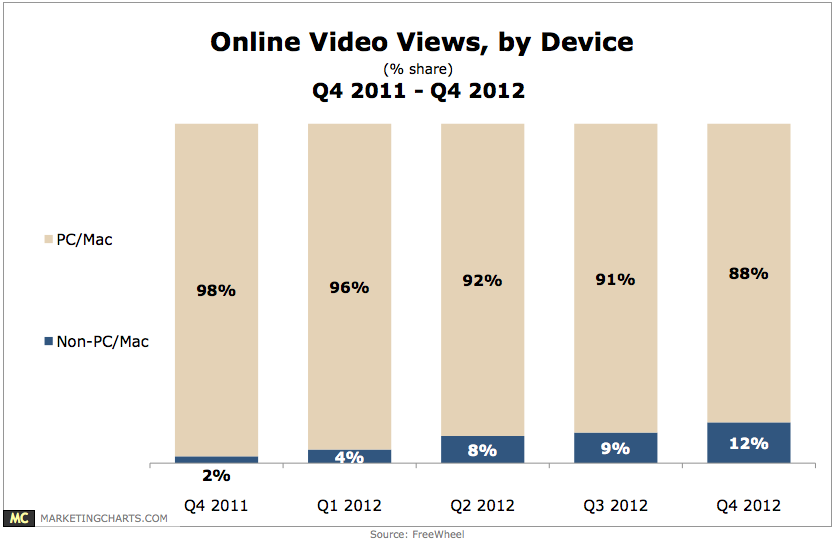
In Q4 2012, non-PC/Mac devices accounted for 12% of video views, triple their share from Q1, and 6 times their share from a year earlier.
Read More