Posts Tagged ‘iPhone’
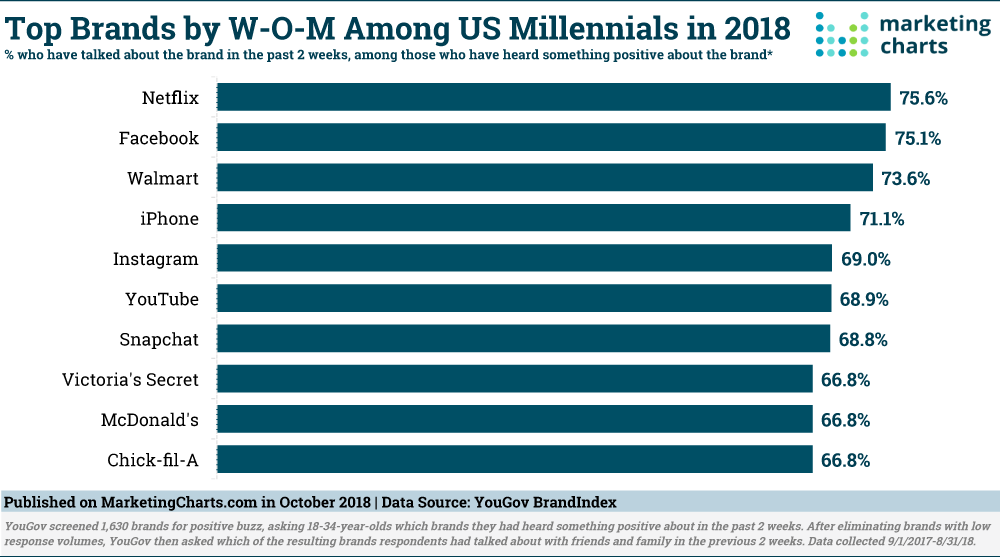
Millennials' Word Of Mouth Brands [CHART]
Which brands are Millennials (18-34) not only hearing positive things about, but also talking about with their friends and family?
Read MoreThe Visual Internet [INFOGRAPHIC]
This infographic by Frames Direct illustrates the evolution of the Internet from a text-only to a visual medium.
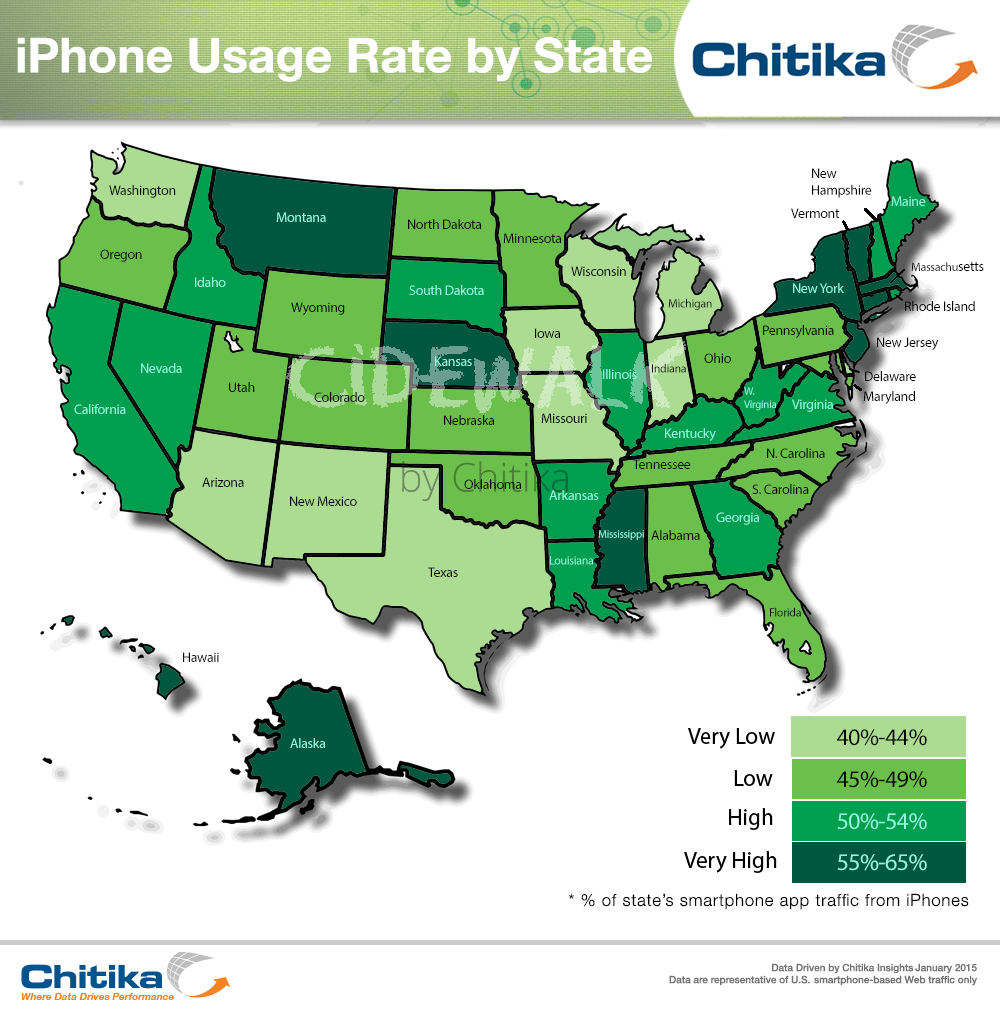
Read MoreiPhone Use Rates By State [MAP]
This infographic illustrates how state-by-state iPhone usage rates correlates with education level and population density. Read more at Chitka.
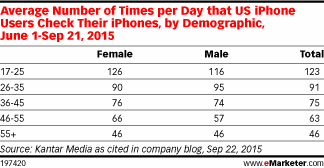
Read MoreHow Frequently iPhone Users Check Their Phones By Demographic [TABLE]
At the most basic level, boomers simply do not use smartphones as often as younger people do.
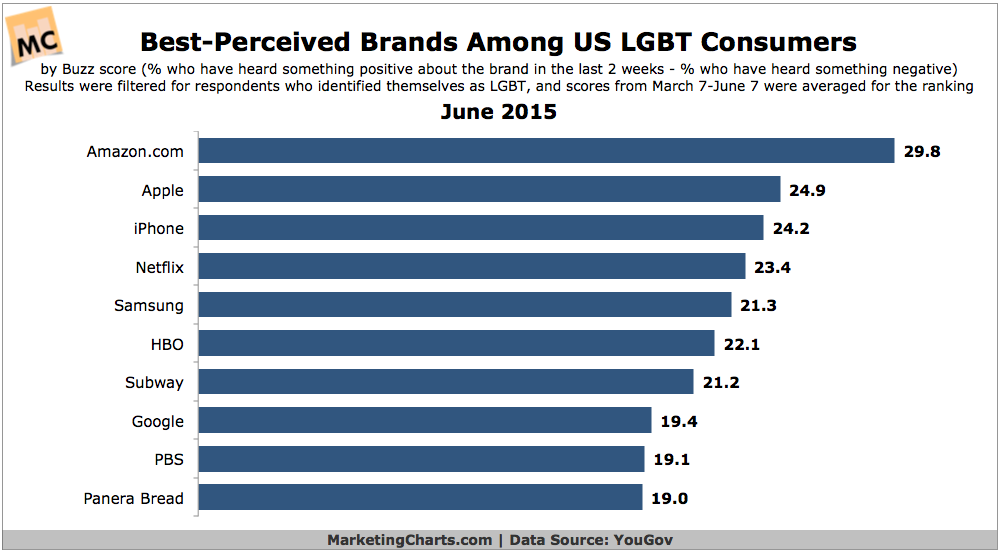
Read MoreMost Reputable Brands Among US LGBT Consumers, June 2015 [CHART]
Amazon.com is this year’s top-perceived brand among LGBT consumers, jumping from the #6 spot last year.
Read MoreThe History of Online Advertising [INFOGRAPHIC]
This infograph by PointRoll illustrates the history of online advertising.
Read MoreGlobal Mobile Video Ad Impressions By OS & Device, Q3 2014 [CHART]
iOS devices accounted for just 32.3% of global mobile ad impressions served during the third quarter on the Opera platform.
Read MoreMobile App Use, Q4 2011-Q4 2013 [CHART]
Adult iPhone and Android owners in the US used an average of 26.8 applications per month during Q4 2013.
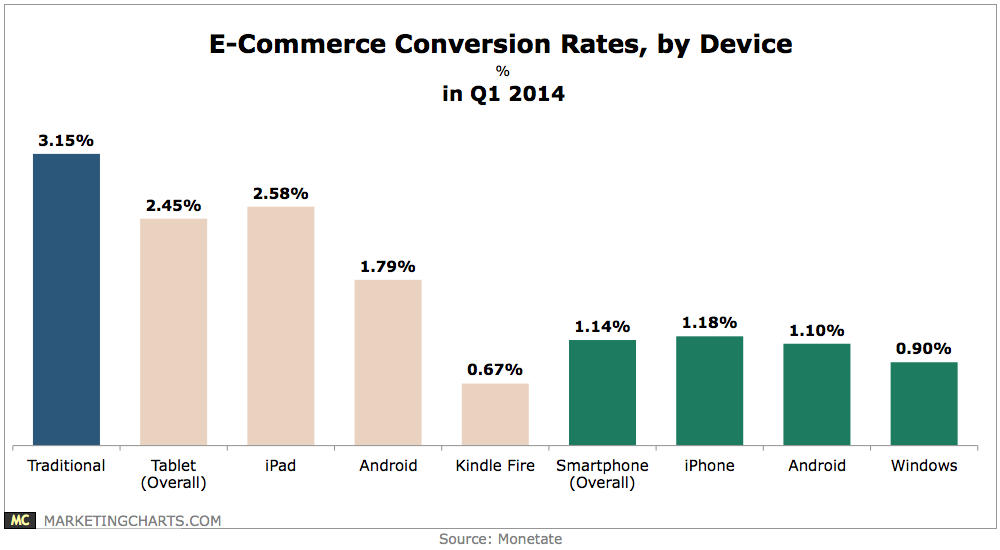
Read MoreE-Commerce Conversion Rates By Device, Q1 2014 [CHART]
Tablet (2.45%) and smartphone (1.14%) conversion rates trailed traditional computers (3.15%) again in Q1.
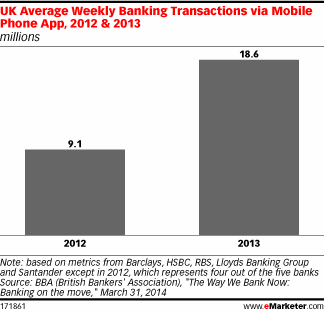
Read MoreUK Average Weekly Mobile Banking Transactions, 2012 & 2013 [CHART]
BBA found that the average number of mobile banking transactions conducted weekly via mobile app more than doubled between 2012 and 2013, from 9.1 million to 18.6 million.
Read More