Posts Tagged ‘Infographics’
Most Useful Forms Of Content For Making B2B Online Purchases, August 2014 [CHART]
B2B end-user buyers worldwide were most likely to begin researching work-related purchases on search engines (35%) and manufacturers’ websites (27%).
Read MoreMost Helpful Content For B2B Executives, October 2014 [CHART]
Articles top the list of content forms that B2B executives have found most helpful for a business-related matter during the past 12 months.
Read MoreTop Characteristics Of Successful B2B Content, October 2014 [CHART]
Three-quarters of business executives seek out content in order to research a business idea.
Read More2015 B2B Content Marketing Trends [INFOGRAPHIC]
This infographic by uberflip illustrates some content marketing trends B2B marketers can expect in 2015.
Read MorePopular Types Of Video, August 2014 [CHART]
Roughly 6 in 10 US adults say they watch videos when they visit a brand website with video content, and 4 in 10 prefer watching a brand video over reading the same information.
Read MoreTypes Of Blog Content, June 2014 [CHART]
Among US bloggers studied, nearly three-quarters of respondents used an image such as a stock photo or diagram in their blog posts, and 44.5% reported including more than one.
Read MorePrivacy & Web Cookies [INFOGRAPHIC]
This inforgraphic from Search Engine Journal illustrates how web cookies work and their implication for online privacy.
Read MoreHow People Interact With Media Brands On Twitter [INFOGRAPHIC]
This inforgraphic from newsworks.org.uk illustrates how Twitter users interact with journalism organizations.
Read MoreBooks Vs. Movies [INFOGRAPHIC]
This infographic from LoveReading.co.uk illustrates which is more popular according to online reviews, the book or the movie upon which it is based.
Read MoreWeb Form Best Practices [INFOGRAPHIC]
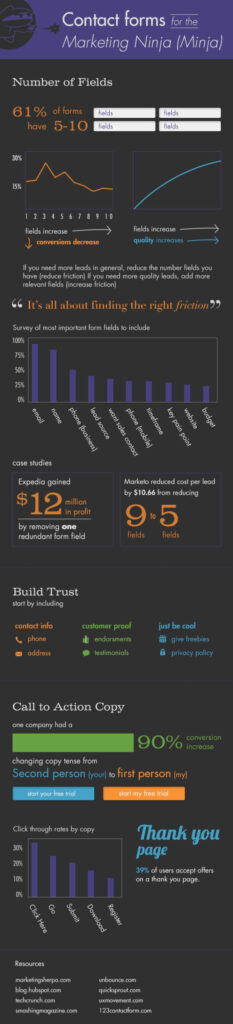
This infographic from SingleHop illustrates web form design best practices.
Read More