Posts Tagged ‘Infographic’
Orange Is The New Black Fans On Social [INFOGRAPHIC]
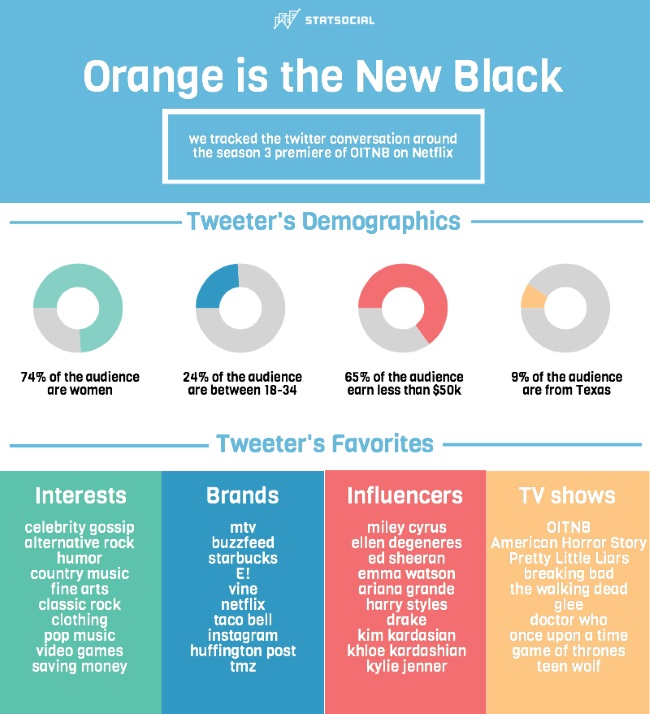
This infographic looks at the demographics and psychographics of Netflix’s Orange Is The New Black fans on social media.
Read MoreThe Cost Of Social Customer Service [INFOGRAPHIC]
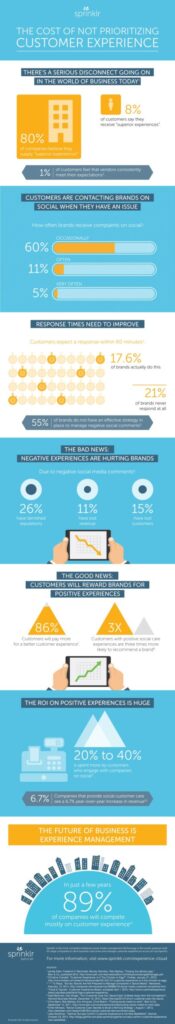
This infographic illustrates the costs of neglecting social customer service.
Read MoreSwearing Customers [INFOGRAPHIC]
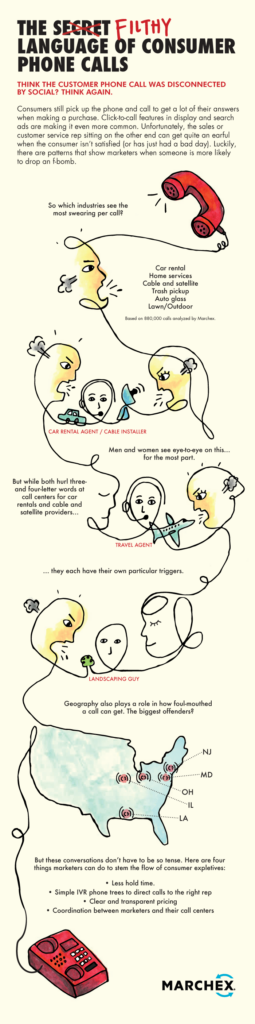
Swearing Customers Infographic: This infographic by Marchex illustrates the industries that earn the foulest-mouthed customers.
Read MoreB2B Social Media [INFOGRAPHIC]
This infographic by NowSourcing illustrates the countless ways that social media can be used in business-to-business communications.
Read MorePersuasion [INFOGRAPHIC]
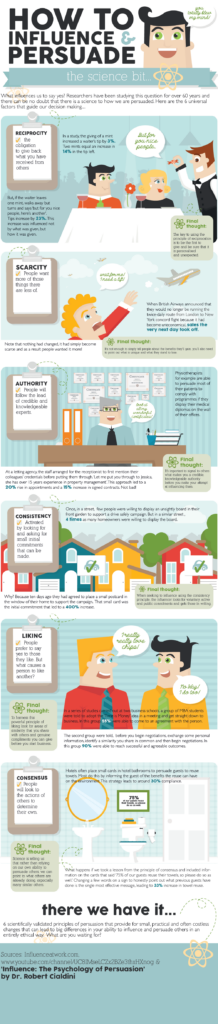
Persuasion Infographic: This infographic by everreach illustrates many of the psychological factors involved in persuasion and influence.
Read MoreUnderstanding Web Graphics [INFOGRAPHIC]
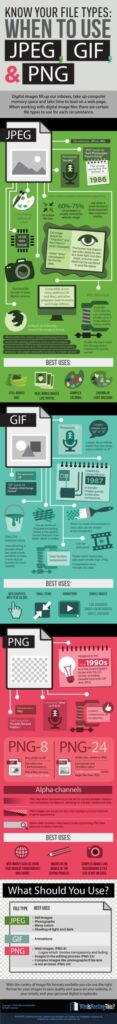
This infographic from Who Is Hosting This illustrates the differences and uses of the most common web graphic file types: JPG, Gif& PNG.
Read MoreOnline Behavior Of Women [INFOGRAPHIC]
This infographic by Creatage illustrates the online behavior of women.
Read MoreNews Media Economics Trends [INFOGRAPHIC]
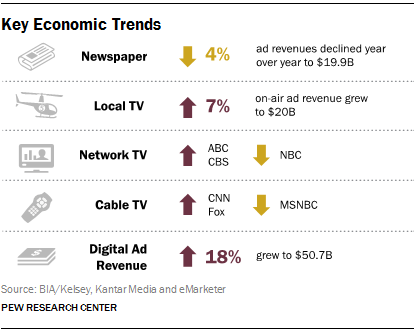
Newspaper ad revenue declined another 4% year over year, to $19.9 billion – less than half of what it was a decade ago.
Read MoreTraditional News Consumption Trends [INFOGRAPHIC]
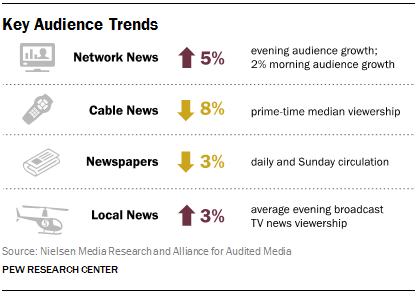
Even as mobile and social news habits evolve, legacy platforms have by no means been abandoned, though some are faring better than others.
Read MoreMobile News Traffic [INFOGRAPHIC]
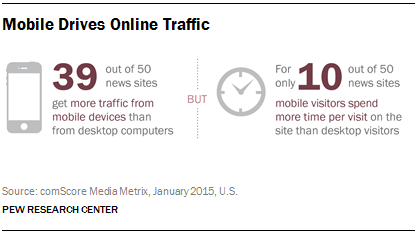
At the start of 2015, 39 of the top 50 digital news websites have more traffic to their sites and associated applications coming from mobile devices than from desktop computers.
Read More