Posts Tagged ‘Infographic’
The Internet Of Things Landscape [INFOGRAPHIC]
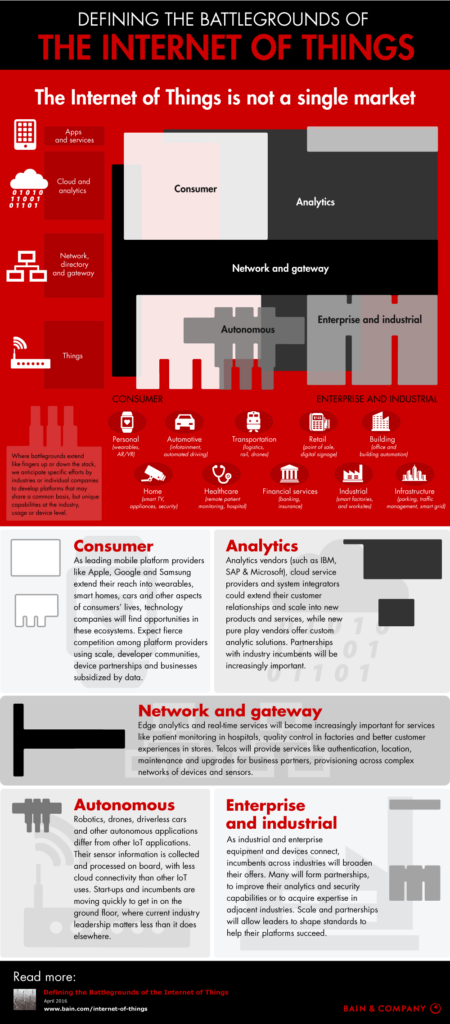
Forecasters predict up to 20 billion IoT devices within a few years. This Internet of Things Landscape infographic makes sense of it all.
Read MoreSocial Media Sites Where Americans Get News [INFOGRAPHIC]
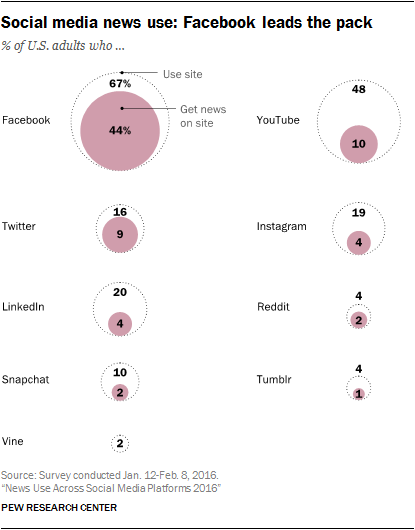
As part of an ongoing examination of social media and news, Pew Research Center analyzed the scope and characteristics of social media news consumers across nine social networking sites.
Read MoreInternet Firsts [INFOGRAPHIC]
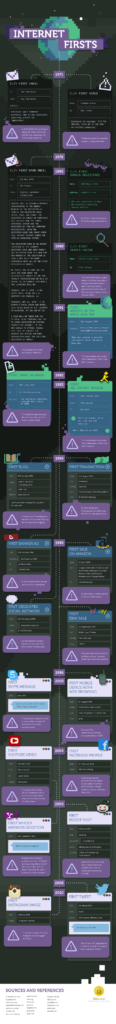
This infographic from SSLs.com highlights some of the milestones of internet history, from the first email to the first eCommerce transaction to the first tweet.
Read More5 Public Relations Case Studies [INFOGRAPHIC]
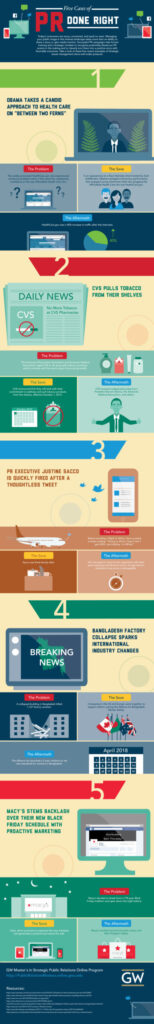
The following infographic from George Washington University’s Master’s in Strategic Public Relations Program illustrates five public relations case studies in which organizations successfully addressed a delicate communications problem.
Read MoreBuyer's Journey Budgeting [INFOGRAPHIC]
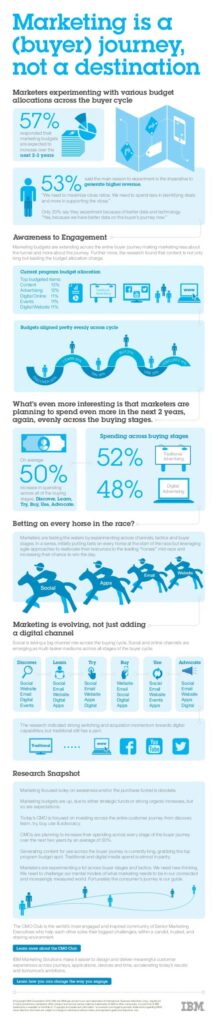
This buyer’s journey budgeting infographic from IBM and The CMO Club illustrates that content generation is the biggest expenditure for the CMOs surveyed.
Read MoreGoogle+ Usage [INFOGRAPHIC]
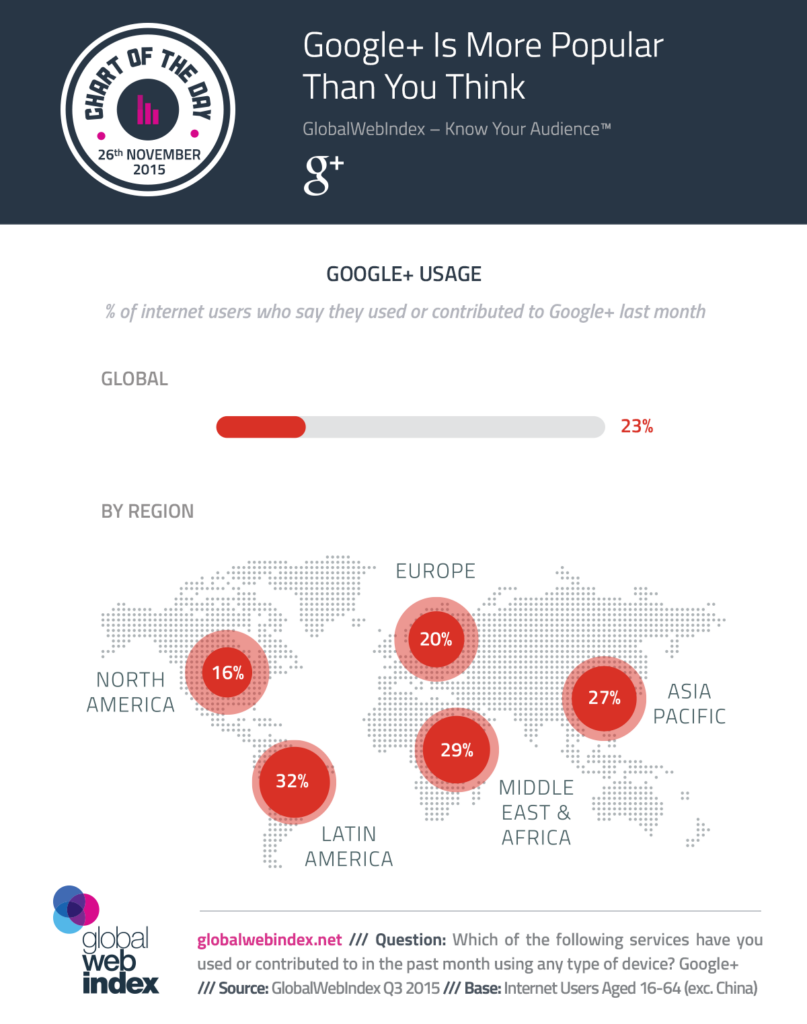
Despite having stripped back some of its core features recently, 1 in 4 Internet users still use Google+ each month (rising higher in some fast-growth markets).
Read MoreCreating Shareable Content [INFOGRAPHIC]
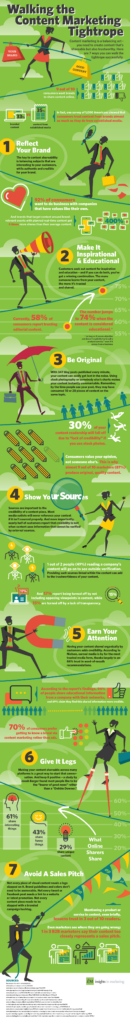
This infographic from Insights In Marketing illustrates 7 steps for creating trustworthy, shareable content.
Read MoreThe Internet Of Things [INFOGRAPHIC]
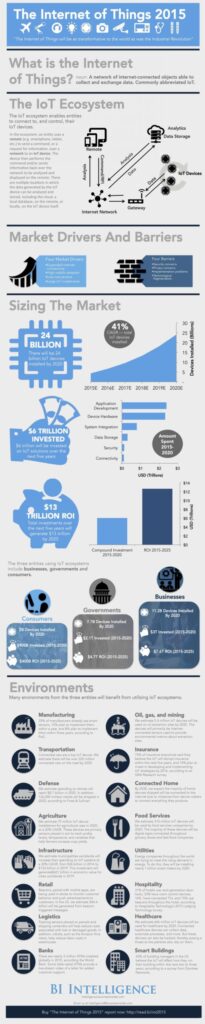
This infographic from BI Intelligence illustrates the state of the industry based on the publication’s most recent report.
Read More2015 Holiday Shopping Trends [INFOGRAPHIC]
This infographic from think with Google illustrates five holiday shopping trends you’ll want to keep an eye on for the 2015 retail season.
Read MoreInstagram Hashtags [INFOGRAPHIC]
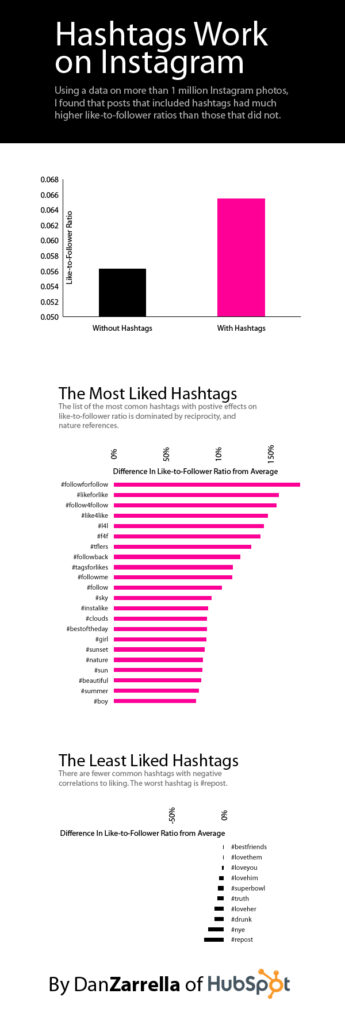
This infographic by Dan Zarrella illustrates the effect of hashtag use on Instagram.
Read More