Posts Tagged ‘Infographic’
Psychology Of Advertising [INFOGRAPHIC]
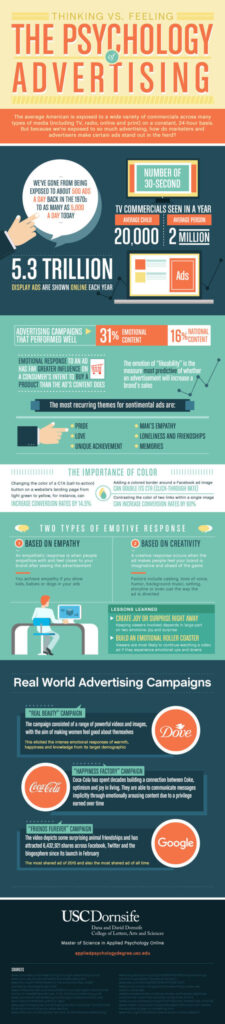
This infographic from USC Dornsife College illustrates the logic and emotions that come into play as advertising attempts to persuade us.
Read MoreLinkedIn Profile Photos [INFOGRAPHIC]
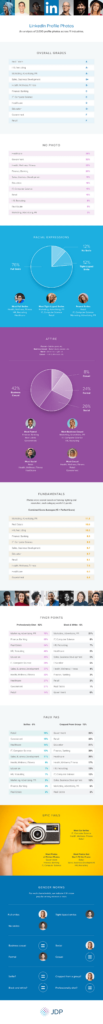
This infographic from JDP illustrates how people in 11 different industries use their profile photos, from whether or not they smile to their attire.
Read MoreTop 100 Non-Brand Keywords At Google [INFOGRAPHIC]
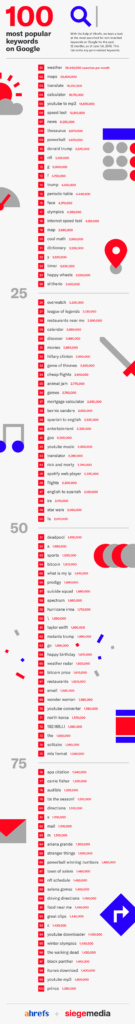
This infographic from siegemedia illustrates the top 100 non-brand keywords used at Google for the year prior to June 1, 2018.
Read MoreEmotion In Video Ads [INFOGRAPHIC]
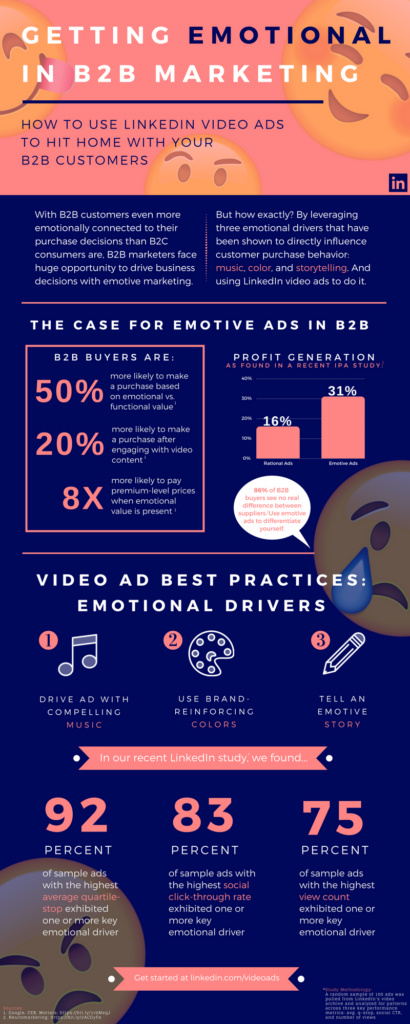
This infographic from LinkedIn highlights statistics that make the case for using emotion in your video ads.
Read MoreAligning Marketing & Sales Content [INFOGRAPHIC]
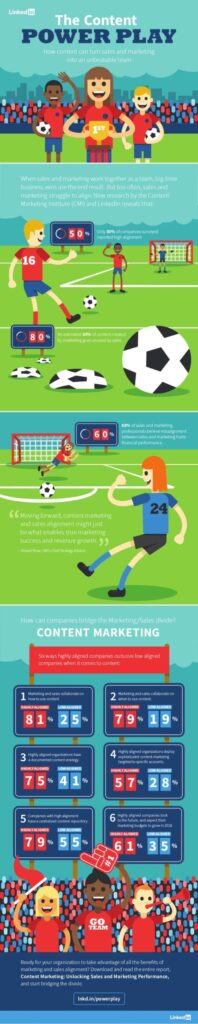
This infographic from LinkedIn is based on data from the “Content Marketing: Unlocking Sales & Marketing Performance” report that highlights the misalignments between marketing and sales teams in organizations.
Read More2018 Content Marketing Statistics [INFOGRAPHIC]
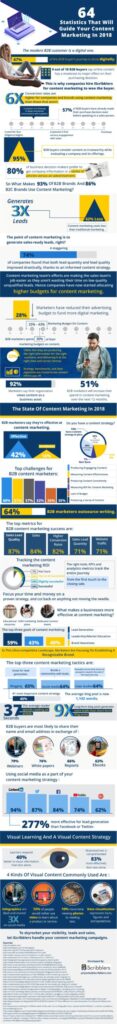
This infographic from iScribblers highlights 64 content marketing statistics that can inform your efforts.
Read MoreLead Generation From Content Marketing [INFOGRAPHIC]
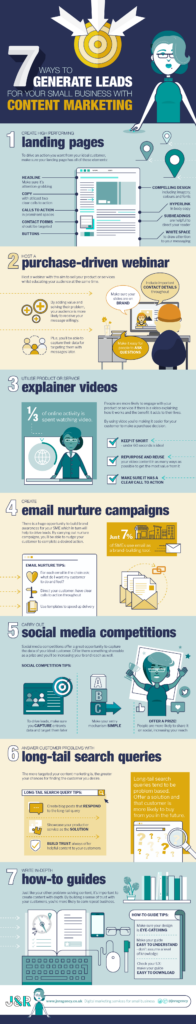
This infographic from J&R illustrates seven ways small businesses can generate leads with content marketing.
Read MoreInstagram Influence [INFOGRAPHIC]

This infographic from X-Cart illustrates the many ways in which Instagram is exerting its influence as a social media channel.
Read MoreGoogle AdWords vs Facebook Ads [INFOGRAPHIC]
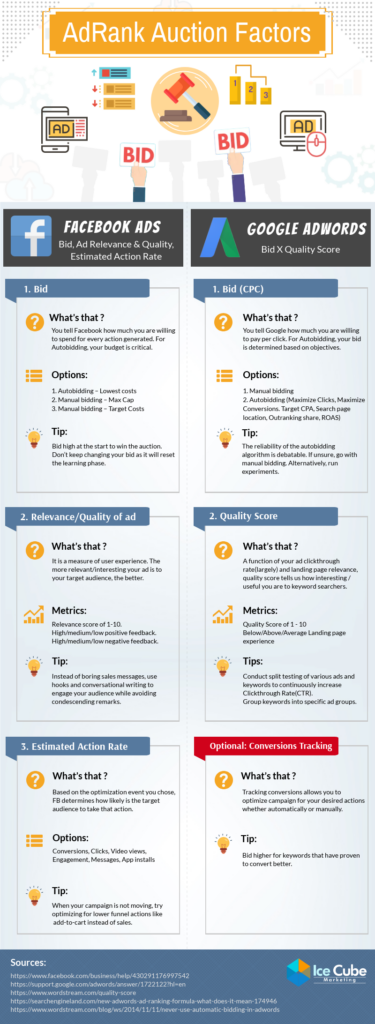
This infographic from Ice Cube illustrates the differences between Google AdWords auction system and the Facebook advertising auction system.
Read MoreElements Of Successful Websites [INFOGRAPHIC]

This infographic from Quicksprout illustrates 10 elements that contribute to a successful website.
Read More