Posts Tagged ‘Hospitality Marketing’
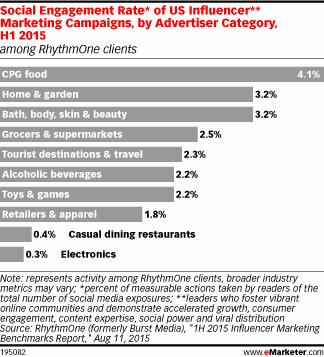
Social Engagement Rate For US Influencers By Industry, H1 2015 [CHART]
The Social engagement rate for US influencers averaged 3.4% in H1 2015.
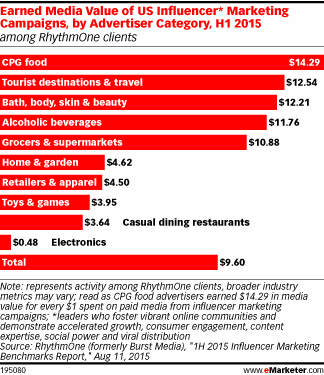
Read MoreEarned Media Value Of Influencer Marketing By Industry, H1 2015 [CHART]
The average earned media value from US influencer marketing programs was 1.4 times higher in H1 2015 than the overall average in full-year 2014.
Read MoreThe Internet Of Things [INFOGRAPHIC]
This infographic from BI Intelligence illustrates the state of the industry based on the publication’s most recent report.
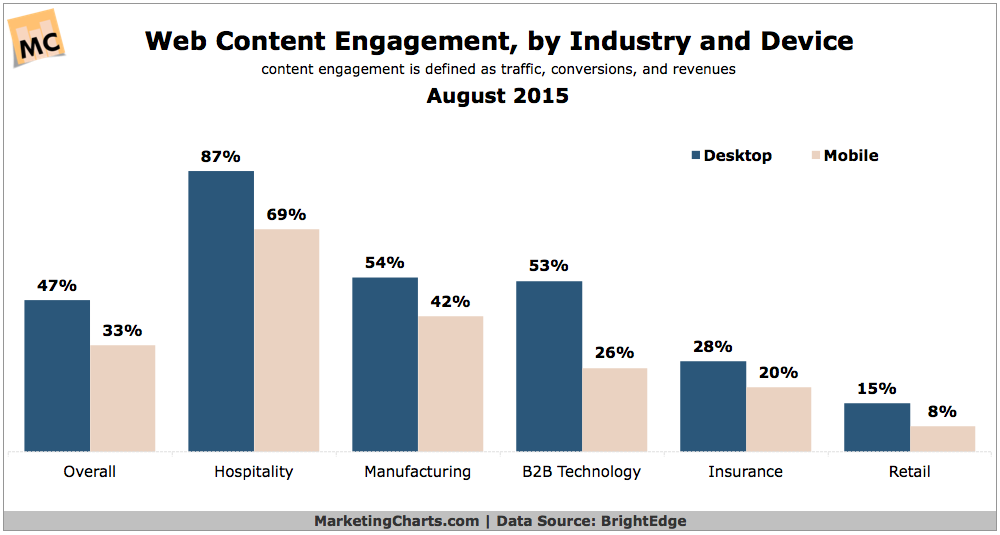
Read MoreWebsite Content Engagement By Desktop Or Mobile, August 2015 [CHART]
Consumers engage with 20% of B2C content on average, though average engagement with B2B content is higher (50%).
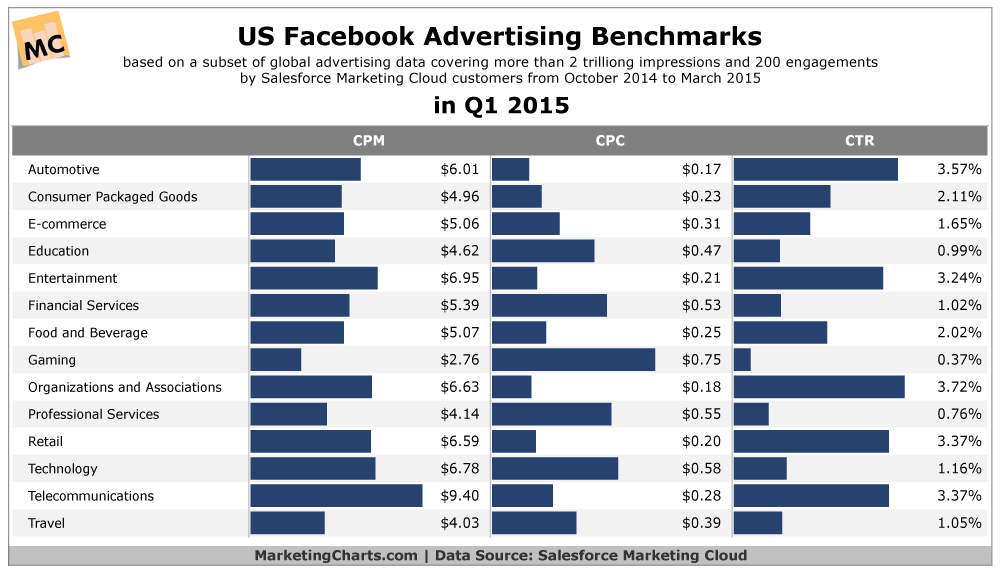
Read MoreFacebook Advertising Benchmarks, Q1 2015 [CHART]
Facebook advertising CPMs were highest for the telecommunications industry and lowest for the gaming vertical in Q1 2015.
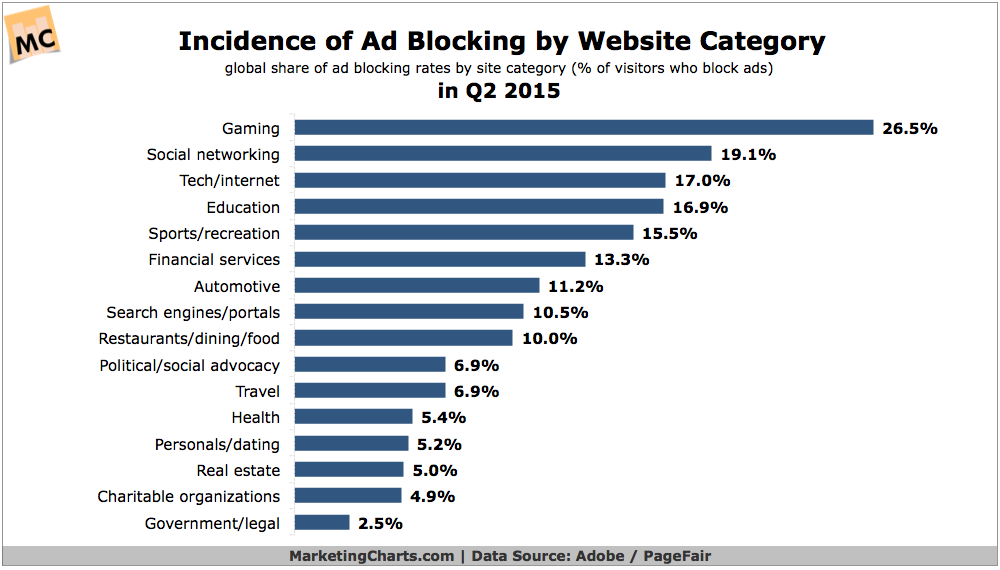
Read MorePrevalence Of Ad Blocking By Website Category, Q2 2015 [CHART]
Globally, the number of internet users who use ad blocking software grew by 41% year-over-year in Q2 and reached 198 million in June,
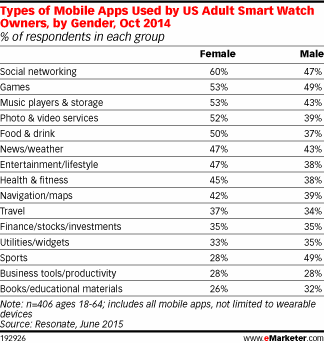
Read MoreMost Popular Smart Watch Apps By Gender, October 2014 [TABLE]
Most Popular Smart Watch Apps By Gender: Women liked social networking apps the best while men liked sports and gaming apps best.
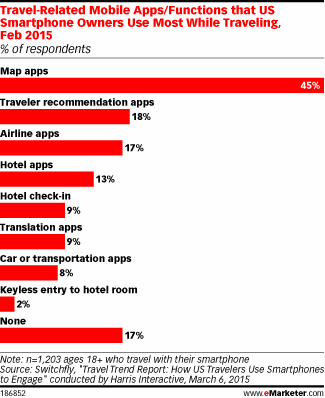
Read MoreMost-Used Travel Apps, February 2015 [CHART]
Map applications ranked as the No. 1 travel-related apps used by US smartphone owners when on trips, cited by 45%.
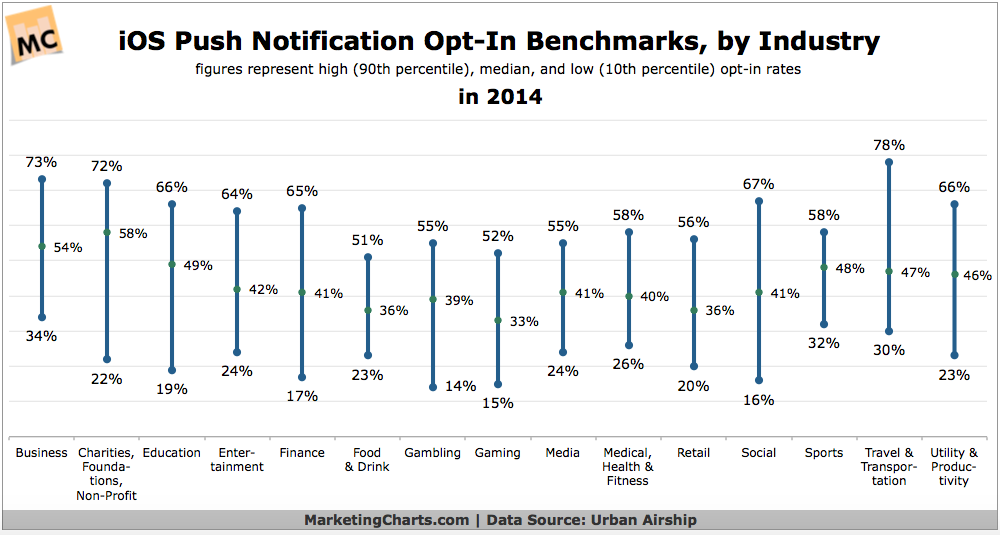
Read MoreApp Notification Opt-in Benchmarks By Industry, 2014 [CHART]
Mobile applications examined by Urban Airship across 15 industries had a median push notification opt-in rate of 42% in 2014.
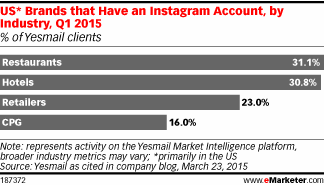
Read MoreBrand Adoption Of Instagram By Industry, Q1 2015 [CHART]
Brand Adoption of Instagram: Just 23% of US brands had an account on Instagram.
Read More