Posts Tagged ‘Home Improvement Marketing’
How Americans Spend Their Evenings
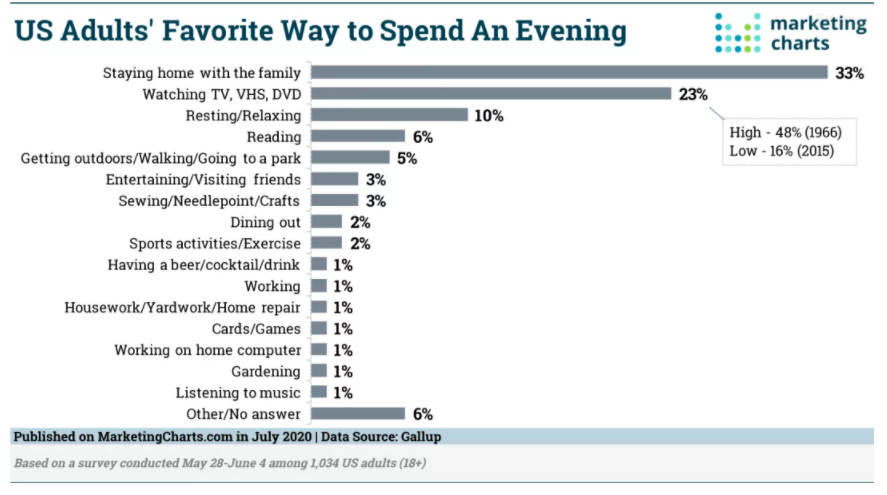
For most Americans, staying home with family is their favorite way to spend an evening, per results from a Gallup survey.
Read MoreTop Shopping Categories [INFOGRAPHIC]
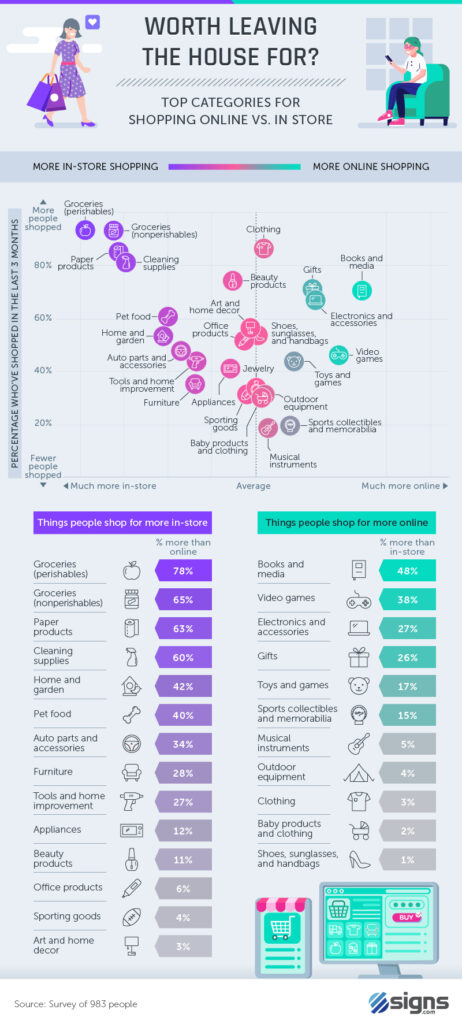
This infographic from signs.com illustrates which retail shopping categories are most popular online versus in brick and mortar stores.
Read MoreFacebook Advertising Benchmarks [INFOGRAPHIC]
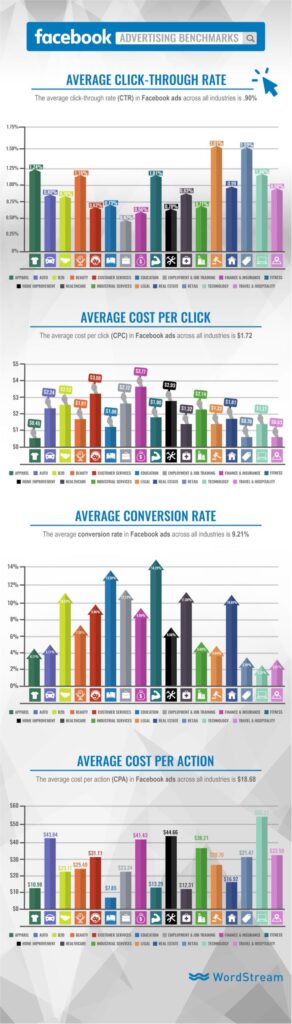
This infographic from WordStream illustrates the most important Facebook advertising benchmarks, including click-through rate, cost-per-click, conversion rate, and cost-per-action across 18 different industries.
Read MoreFrequency Of Pinterest Users' Online Purchases By Category, March 2015 [CHART]
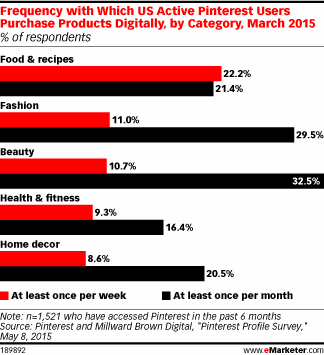
In Q1 2015, Pinterest accounted for the second-highest share of social media-driven site visits in North America, at 19.0%.
Read MoreFastest-Growing Retail eCommerce Categories, 2014 [CHART]
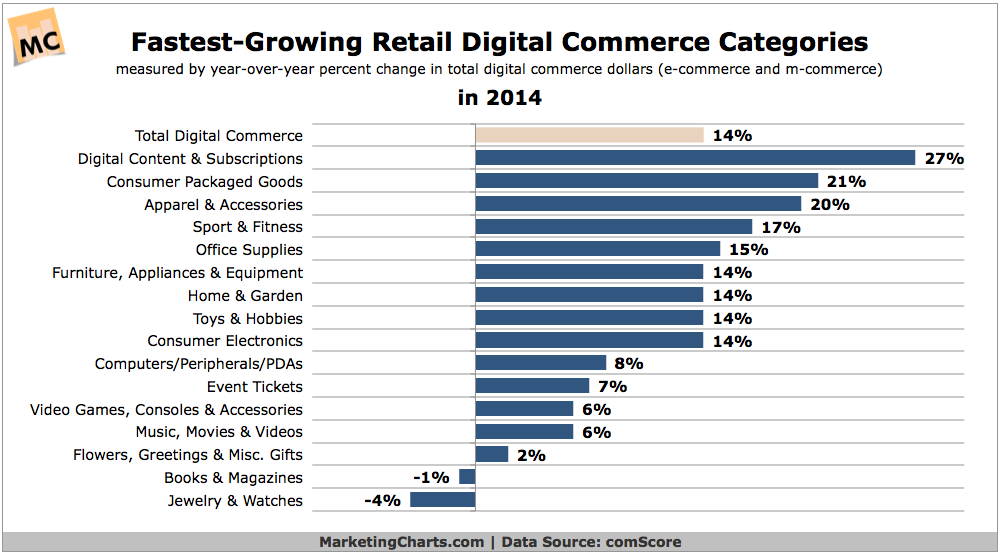
eCommerce and mobile-commerce spending on digital content and subscriptions increased by 27% year-over-year in 2014, almost doubling the overall retail digital commerce growth rate of 14%.
Read MoreBaby Boomers’ Spending Trends, February 2014 [TABLE]
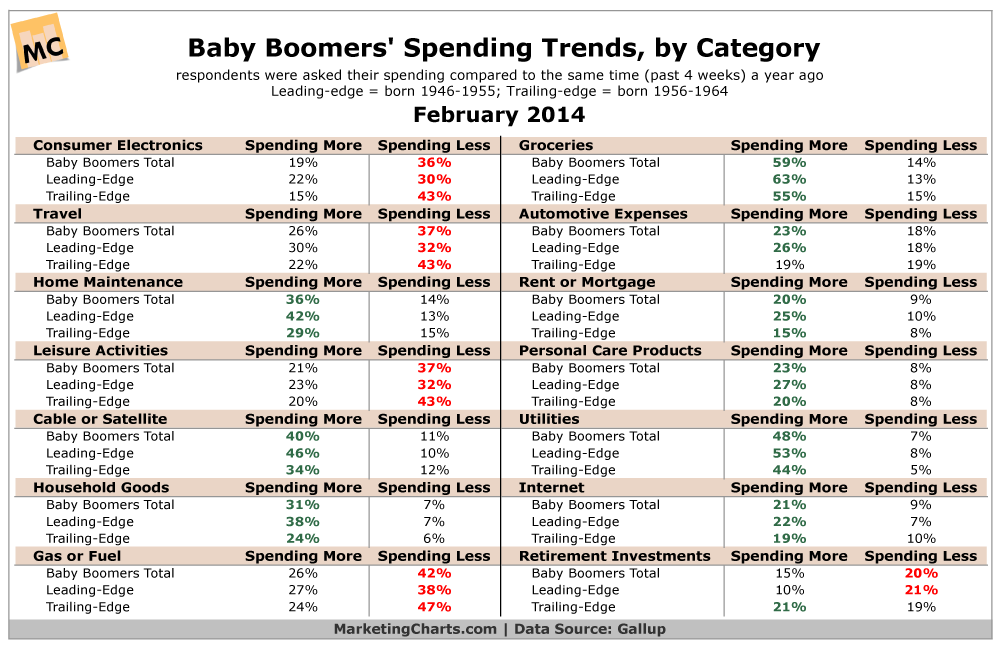
Baby Boomers on the whole report spending more than they were a year ago.
Read MoreAd Traffic Generated By Bots By Industry, September 2014 [TABLE]
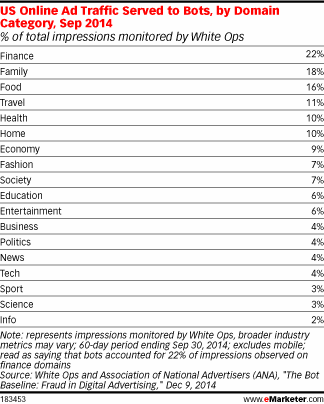
Finance, family and food domains were the most susceptible to bots, with respective traffic rates coming in at 22%, 18% and 16%.
Read MoreDark Social Sharing By Content Type, December 2014 [CHART]
Some 84% of global online consumers aged 16 and older report sharing content online.
Read MoreBaby Boomers' Housing Plans, November 2014 [TABLE]
Some 63% of Baby Boomers plan to age in place and three-quarters describe their home as one they can stay in as they get older.
Read MoreMillennials' Attitudes Toward Rewards Experiences, October 2014 [TABLE]
More than 8 in 10 Millennials would more likely to shop with a grocer if they could redeem rewards for a consultation with a chef or nutritionist.
Read More