Posts Tagged ‘Higher Education Marketing’
Average Social Shares Per Press Mention By Industry [CHART]
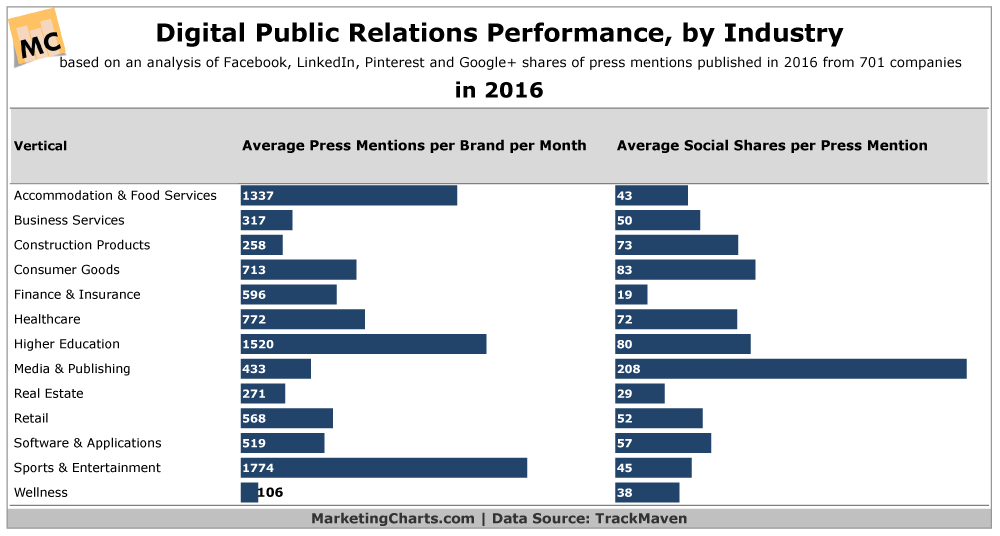
Higher education institutions got the most bang for the buck in digital PR last year, enjoying an average of more than 121,000 social shares from press mentions per month.
Read MoreAmericans' Positive Attitudes Toward Select Institutions [CHART]
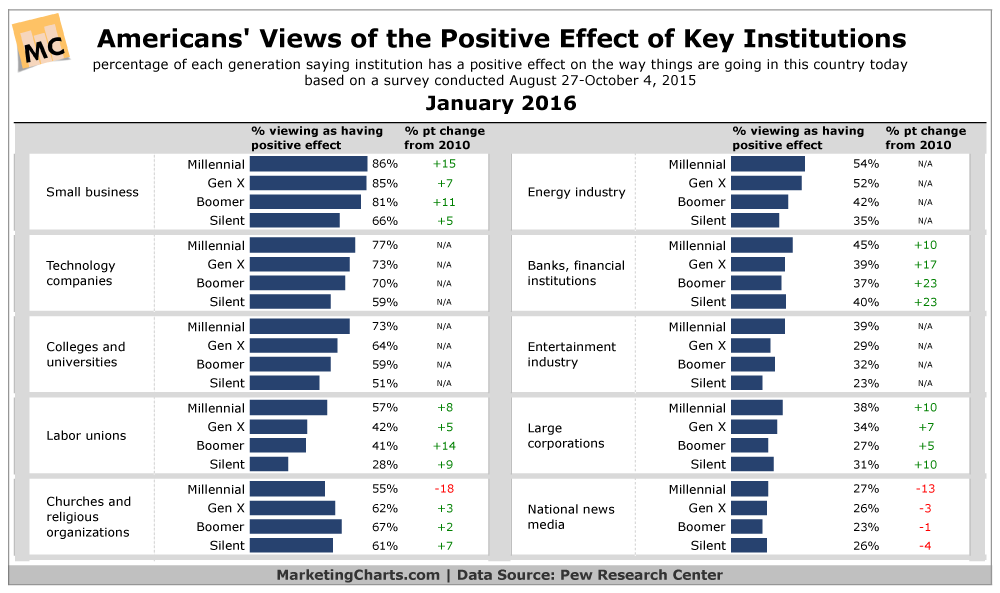
In some cases, there are marked variations in the views that American generations have of key institutions in the US.
Read MoreAmerican College Student Demographics, 2013 [CHART]
The number of Americans enrolled in college (undergraduate and graduate) declined by almost half a million for the second consecutive year in 2013.
Read MoreDemographics Of US College Graduates In 2013 [CHART]
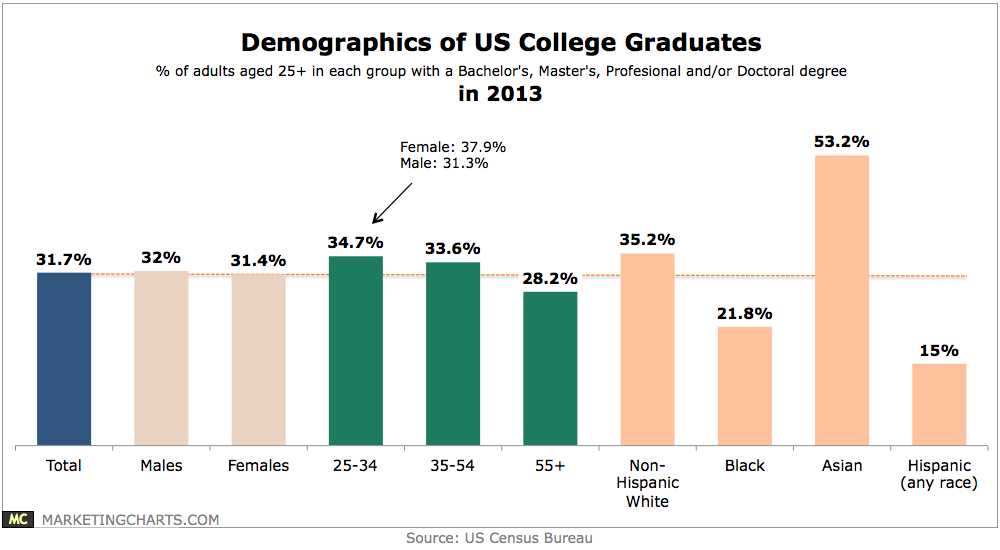
About 31.7% of Americans aged 25 years and older last year had earned a Bachelor’s, Master’s, Professional and/or Doctoral degree, up from 30.4% in 2011.
Read MoreAffluent Americans' Annual Expenditures, September 2013 [TABLE]
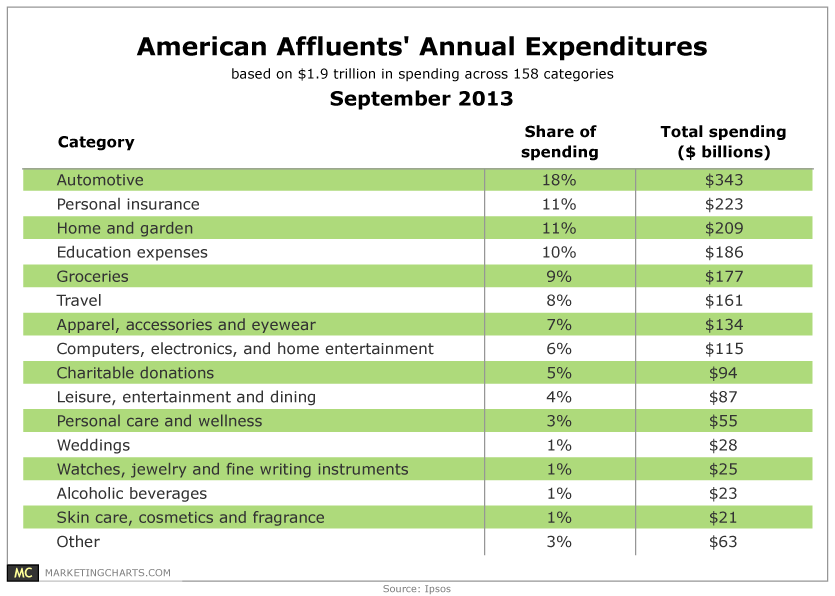
Affluent Americans spend $1.9 billion annually – and that those dollars are highly concentrated among a select group of areas.
Read MoreUS College Student Demographics [CHART]
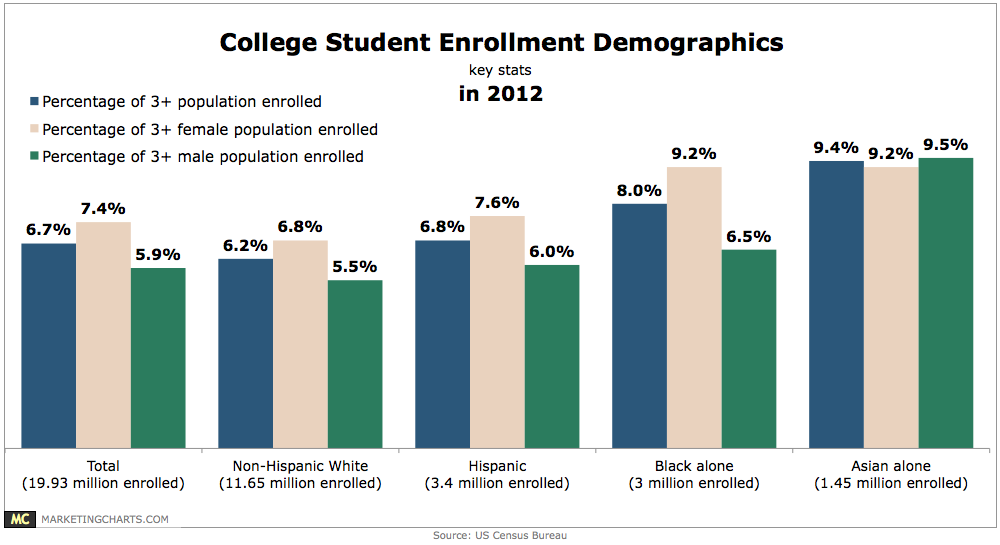
After growing by 3.2 million between 2006 and 2011, the number of Americans enrolled in college (undergraduate and graduate) fell by almost half-a-million last year.
Read MoreUS Mobile Marketing Spending By Industry, 2010-2015 [TABLE]
Finance, insurance and real estate marketers would collectively spend $2.08 billion on US mobile marketing this year, up significantly from about $1.33 billion in 2012.
Read MoreIndustries & Products For Which People Have Written Post-Purchase Online Reviews, October 2012 [TABLE]
Among social network users who took a post-purchase action online, 22% reported posting a review or other comment after an automobile purchase.
Read MoreUS Search Advertising Click-Through Rates By Industry, Q4 2011-Q4 2012 [TABLE]
Only 20% of new-car shoppers in the US buy the brand they first searched for, according to Google data.
Read MoreThe Online Revolution [INFOGRAPHIC]
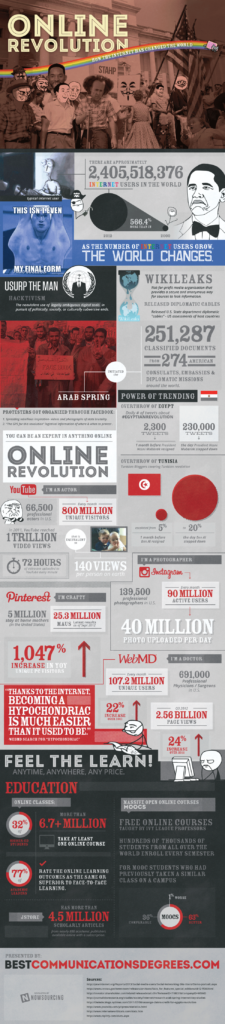
There were more than 2 billion web users in 2012, which is a 566.4% increase from the year 2000
Read More