Posts Tagged ‘Health Care Marketing’
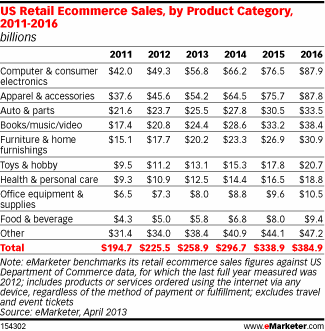
American Retail eCommerce Sales By Product Category, 2011-2016 [TABLE]
Computer and consumer electronics, as well as apparel and accessories, account for the bulk of US retail eCommerce sales.
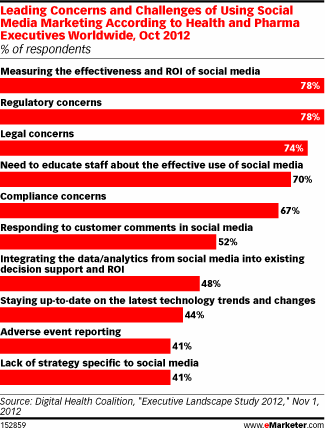
Read MoreChallenges & Concerns About Using Social Media For Health Care Marketing, October 2012 [CHART]
Health care marketers worry about how to measure social media marketing efforts, especially tying the investment in social media directly to brand objectives.
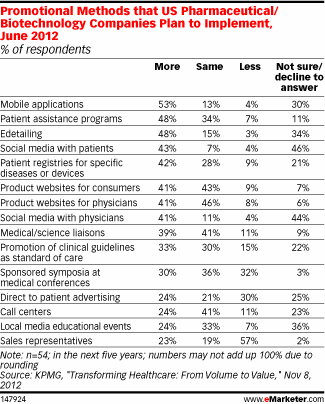
Read MorePromotional Plans Of American Pharmaceutical & Biotech Companies, June 2012 [TABLE]
33% of pharmaceutical companies are digital beginners.
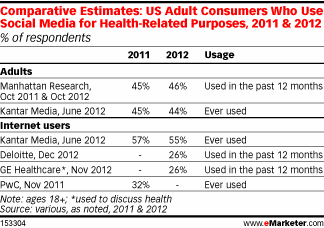
Read MoreAmericans Who Use Social Media For Health Needs, 2011 & 2012 [TABLE]
Roughly 45% of US adult consumers used social media for health-related purposes in 2012.
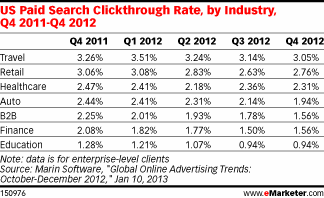
Read MoreUS Search Advertising Click-Through Rates By Industry, Q4 2011-Q4 2012 [TABLE]
Only 20% of new-car shoppers in the US buy the brand they first searched for, according to Google data.
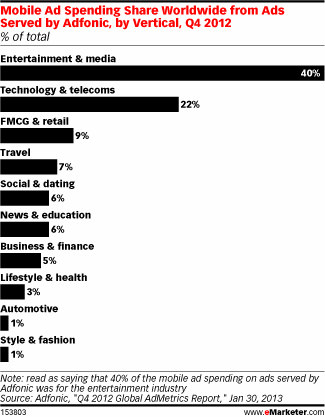
Read MoreGlobal Mobile Ad Spending Share By Vertical, Q4 2012 [CHART]
The worst performers on tablets vs. smart phones were the fast-moving consumer goods and retail industry, along with the social and dating category.
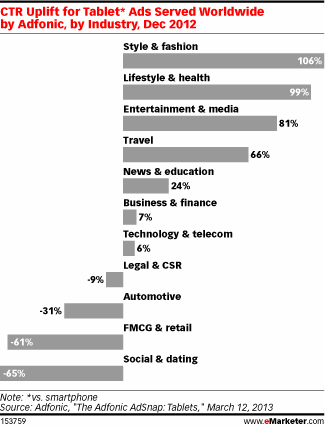
Read MoreTablet Ad Click-Through Rate Uplift By Industry, December 2012 [CHART]
Click-through rates for entertainment and media, as well as the travel category rose by 81% and 66%, respectively.
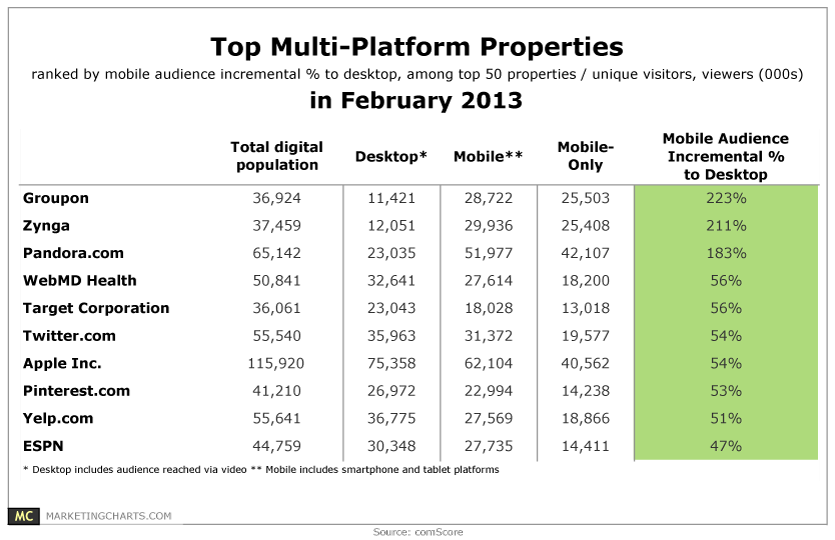
Read MoreTop Multi-Platform Properties, February 2013 [TABLE]
Including mobile audience counts into a web property’s total audience makes a significant difference to reach and rankings.
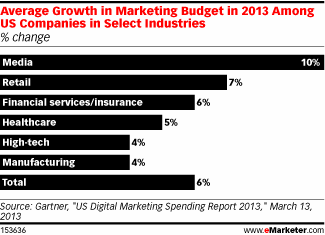
Read MoreAverage Marketing Budget Growth In 2013 For Select US Industries [CHART]
For 2013, marketers are expecting to increase overall marketing budgets by an average of 6%.
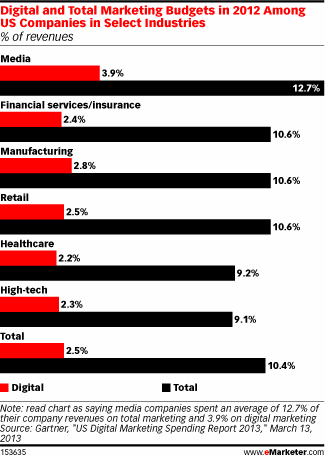
Read MoreOnline vs. Total Marketing Budgets In 2012 For Select Industries [CHART]
On average, companies spent 10.4% of revenues on marketing activities in 2012. Of that budget, 2.5% of total revenues were spent on digital media initiatives.
Read More