Posts Tagged ‘Health Care Marketing’
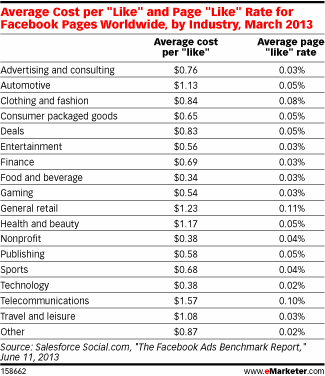
Global Facebook Cost Per Like By Industry, March 2013 [TABLE]
General retail and telecommunications had the most success generating page “likes,” at a rate of 0.11% and 0.10%, respectively.
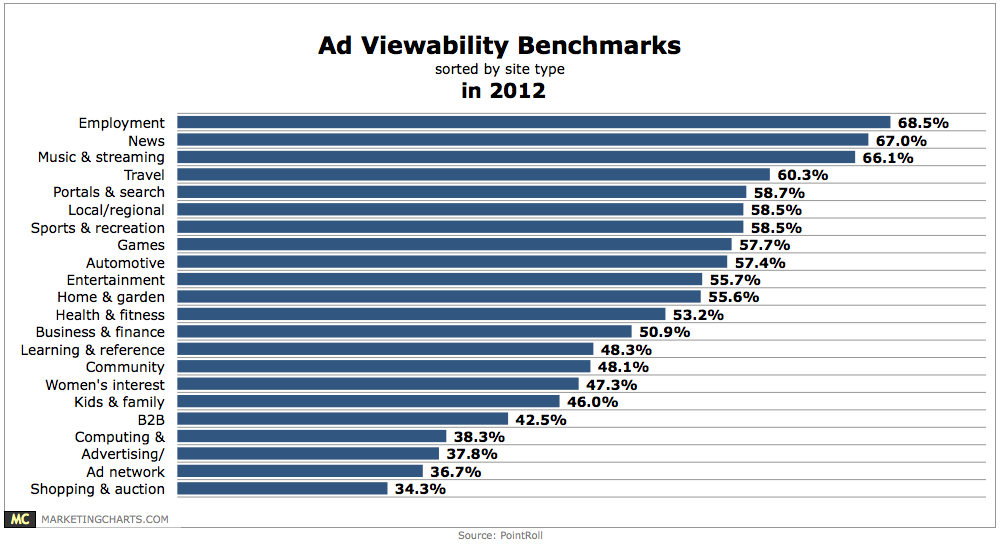
Read MoreAd Viewability Benchmarks By Site Type, 2012 [CHART]
Covering 2012 activity, the data shows that viewability rates were lowest on shopping and auction (34.3%) and ad network (36.7%) sites, and highest on employment (68.5%), news (67%) and music and streaming media (66.1%) sites.
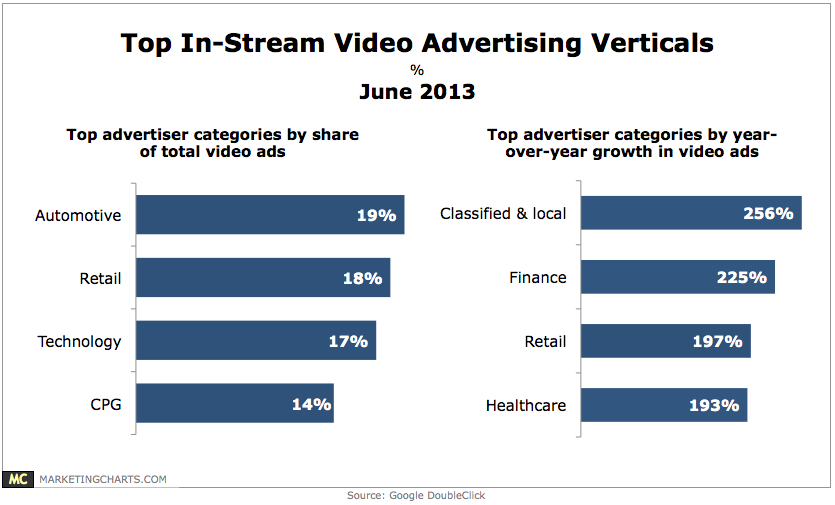
Read MoreTop In-Stream Video Advertising Verticals, June 2013 [CHART]
About 2 in 3 in-stream video ad impressions come from 4 advertiser categories.
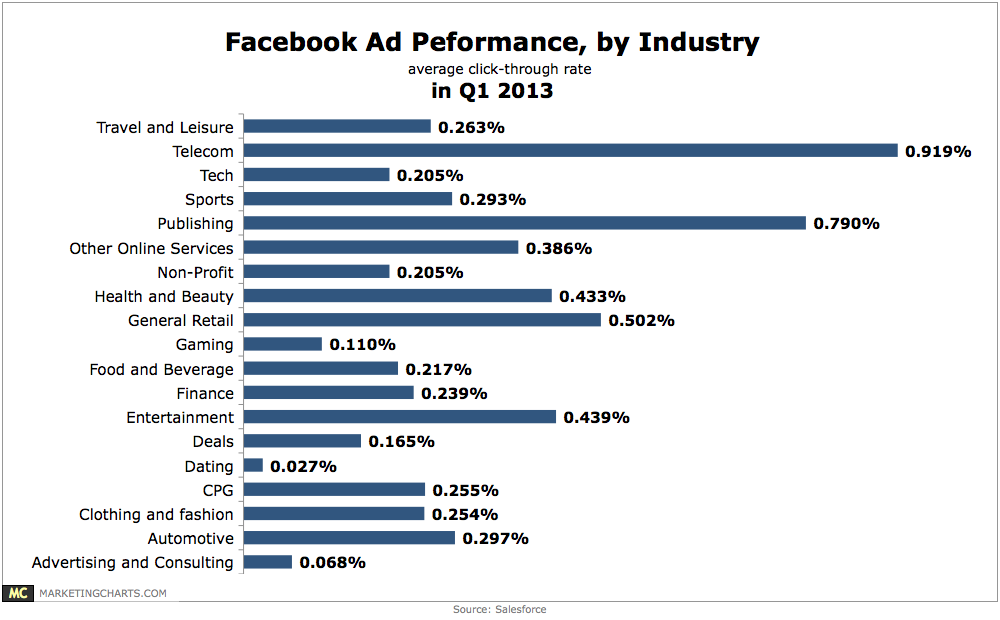
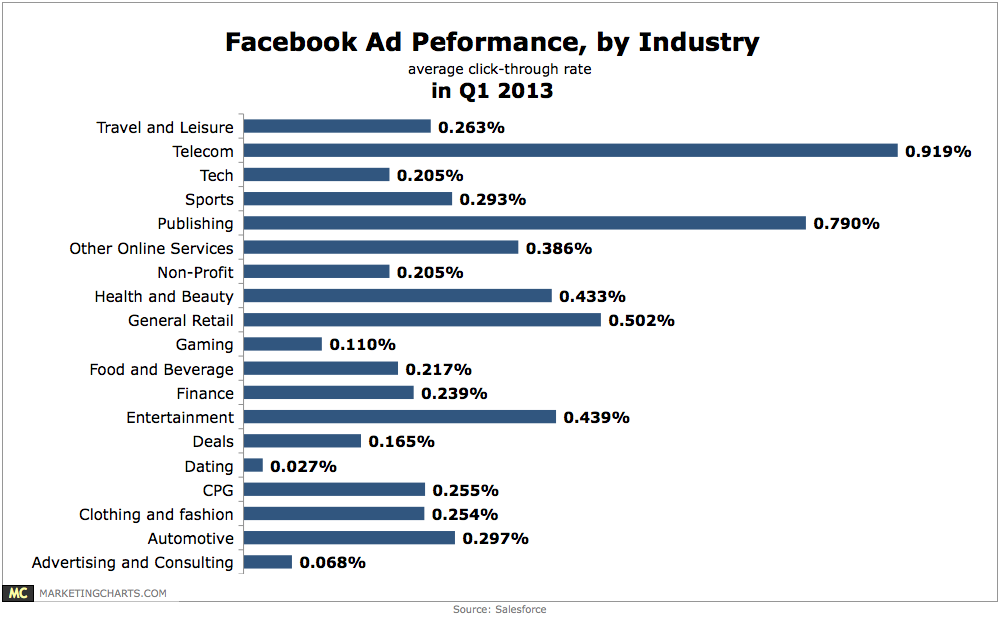
Read MoreFacebook Ad Performance By Industry, Q1 2013 [CHART]
Telecom (0.919%) and publishing (0.79%) brands are leading the charge in Facebook click-through rates.
Read MoreFacebook Ad Performance By Industry, Q1 2013 [CHART]
Telecom (0.919%) and publishing (0.79%) brands are leading the charge in click-through rates.
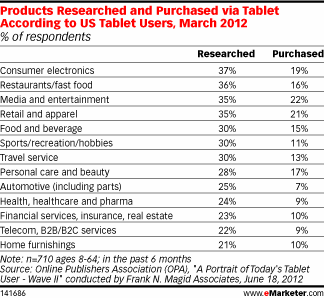
Read MoreProducts Researched & Purchased On A Tablet, March 2012 [TABLE]
A survey from the Online Publishers Association compared product research with product purchase by category among tablet users in March 2013.
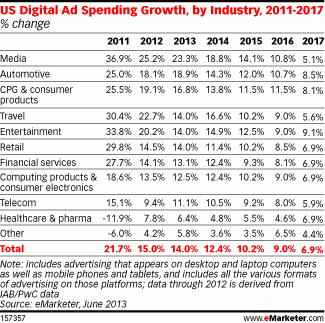
Read MoreUS Online Ad Spending Growth By Industry, 2011-2017 [TABLE]
Four of the six industries growing their digital ad spending at or above overall market rates are retail, financial services, consumer packaged goods & travel.
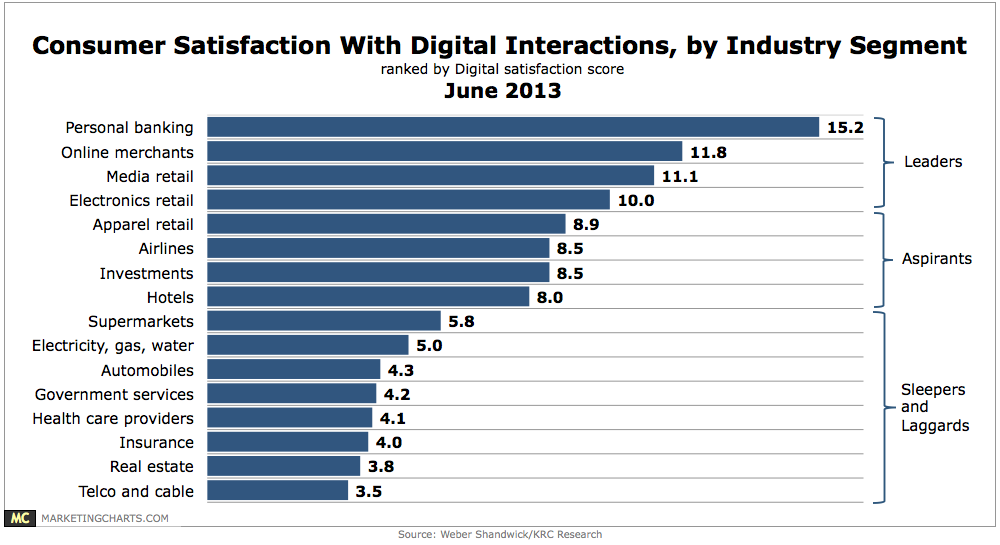
Read MoreCustomer Satisfaction With Online Interactions By Industry Segment, June 2013 [CHART]
E-commerce sites exceeded the threshold of excellence in customer satisfaction last year, according to the American Customer Satisfaction Index.
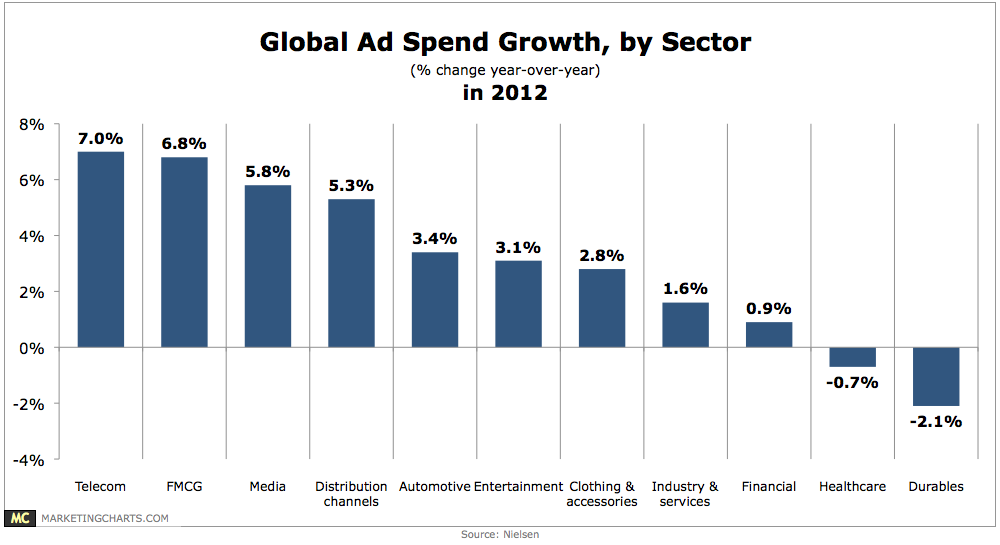
Read MoreGlobal Ad Spending Growth By Sector, 2012 [CHART]
Global ad spending grew by 3.2% last year, but some sectors fared better than others.
Read MoreAmerican Retail eCommerce Sales CAGR By Category, 2012-2017 [CHART]
A mix of larger and smaller online product categories will post the highest CAGRs from 2012 to 2017.
Read More