Posts Tagged ‘Health Care Marketing’
Time Spent Online By Platform & Content Type, April 2013 [TABLE]
Plenty of online content areas were still firmly rooted in PC use, with the desktop accounting for more than 60% of time spent accessing auto, business, TV, news and sports content.
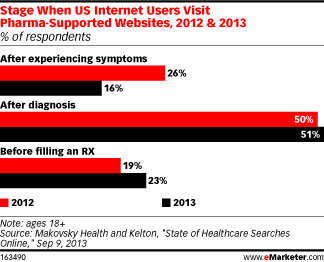
Read MoreStages At Which Consumers Visit Pharmaceuticals Websites, 2012 & 2013 [CHART]
Web users were also most likely to visit pharma websites following a diagnosis, rather than after they experienced symptoms or before they’d filled a prescription.
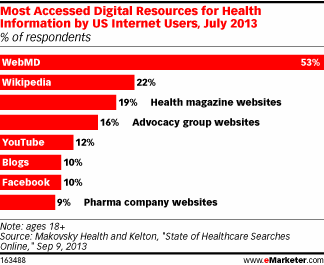
Read MoreMost Popular Sites For Health Information, July 2013 [CHART]
More than half of consumers named WebMD as their most accessed digital resource for health information.
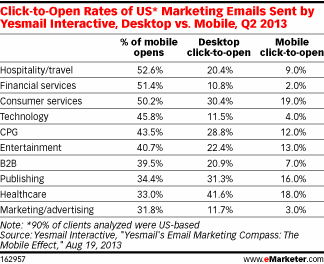
Read MoreMarketing Email Click-To-Open Rates By Industry & Platform, Q2 2013 [TABLE]
While readers clicked on 23% of emails opened on desktop in Q2 2013 in the US, only 11% did so for emails on mobile.
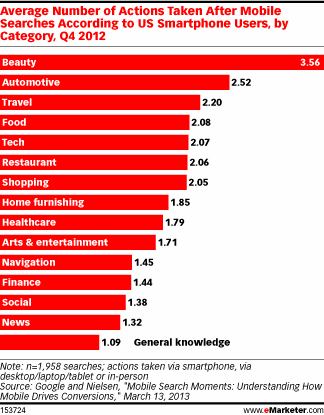
Read MoreAverage Number Of Actions Taken After Mobile Searches By Category, Q4 2012 [CHART]
US smartphone users averaged 2.20 actions after conducting a mobile travel search.
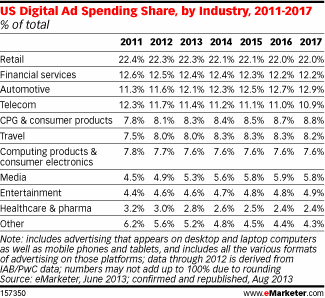
Read MoreUS Online Ad Spending Share By Industry, 2011-2017 [TABLE]
eMarketer expects the retail industry’s share of the total US digital advertising pie to decline slightly, from 22.3% in 2013 to 22.0% in 2017.
Read MoreYelp Reviews & Small Businesses [INFOGRAPHIC]
This infographic from Merchant Warehouse illustrates Yelp reviews affect on small businesses.
Read MoreEmail Click-to-Open Rates By Industry, Q2 2012 [CHART]
49% of email opens happen on a mobile device.
Read MoreActive Email Subscriber Rates By Industry, Q2 2013 [CHART]
B2B email databases had a subscriber activity rate of just 1.5% (referring to the percentage who opened an email in the last 90 days).
Read MoreHealth Care Pros Who Use Multiple Devices On The Job By Specialty, May 2013 [CHART]
The informational needs of doctors and other health care providers have likely helped to push the adoption of mobile devices.
Read More
