Posts Tagged ‘Google’
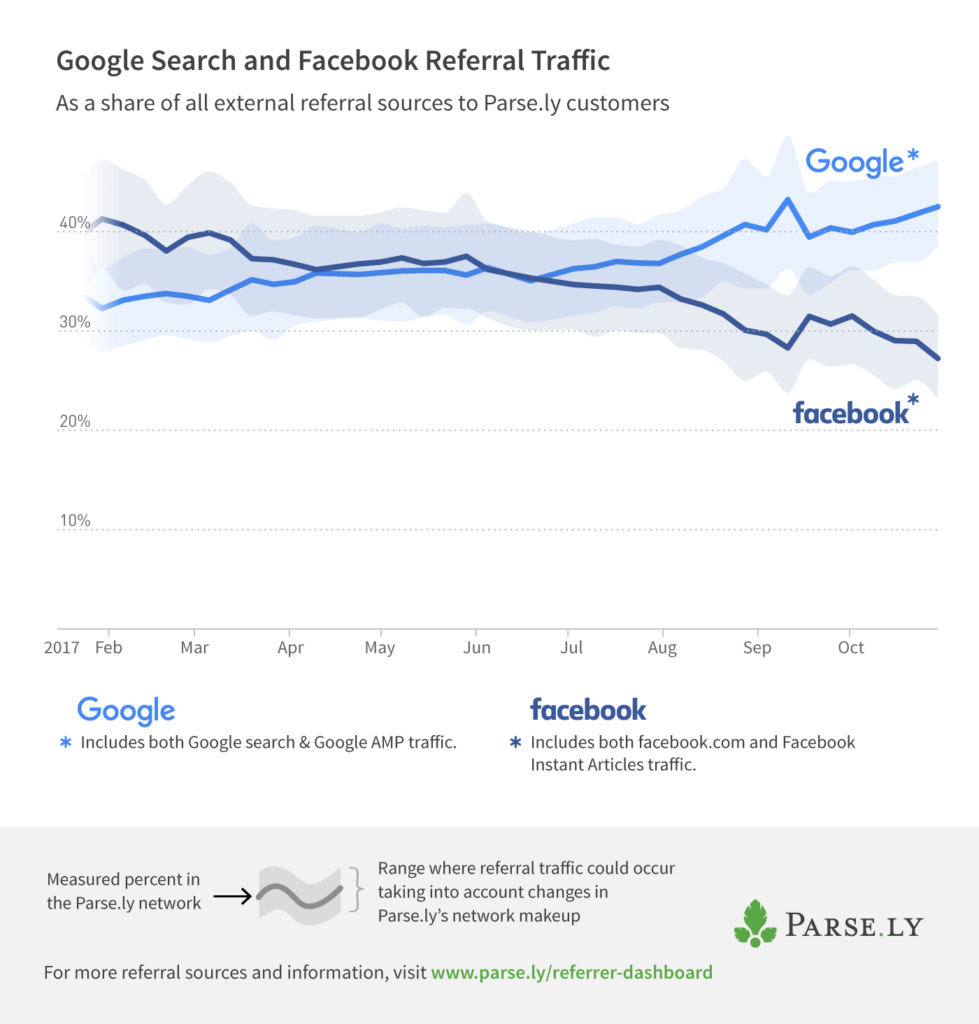
Google vs Facebook Referral Traffic, 2017 [CHART]
This Parse.ly data reflects the upward trend in referral traffic from Google (all – including AMP – Google’s Accelerated Mobile Pages format) and declining trend in referral traffic from Facebook specifically (all Facebook – including Instant Articles).
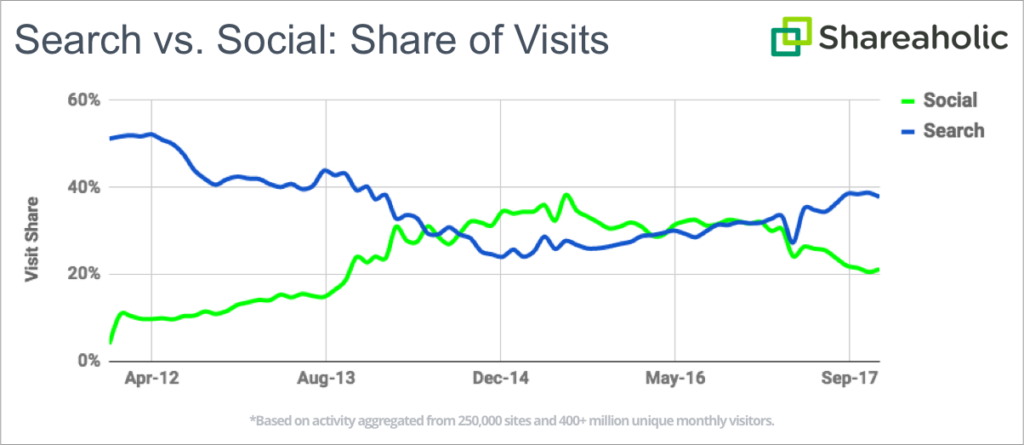
Read MoreSearch Engine vs Social Traffic, 2011-2017 [CHART]
Google was the top overall traffic referrer for the year, and owned a 36.82 percent share of visits during the second half of 2017.
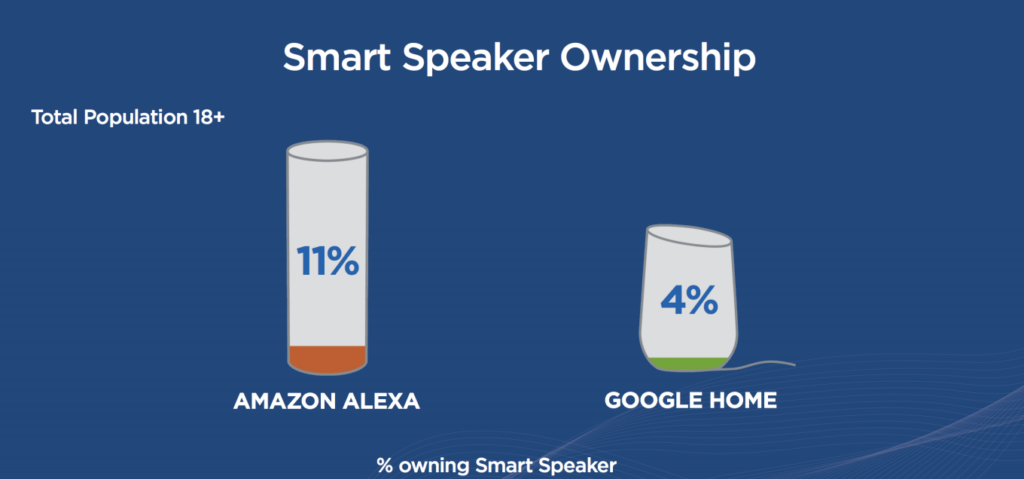
Read MoreSmart Speaker Ownership [INFOGRAPHIC]
One in six Americans now own a smart speaker, according to new research out this week from NPR and Edison Research – a figure that’s up 128 percent from January, 2017. Amazon’s Echo speakers are still in the lead, the report says, as 11 percent now own an Amazon Alexa device compared with 4 percent who own a Google Home product.
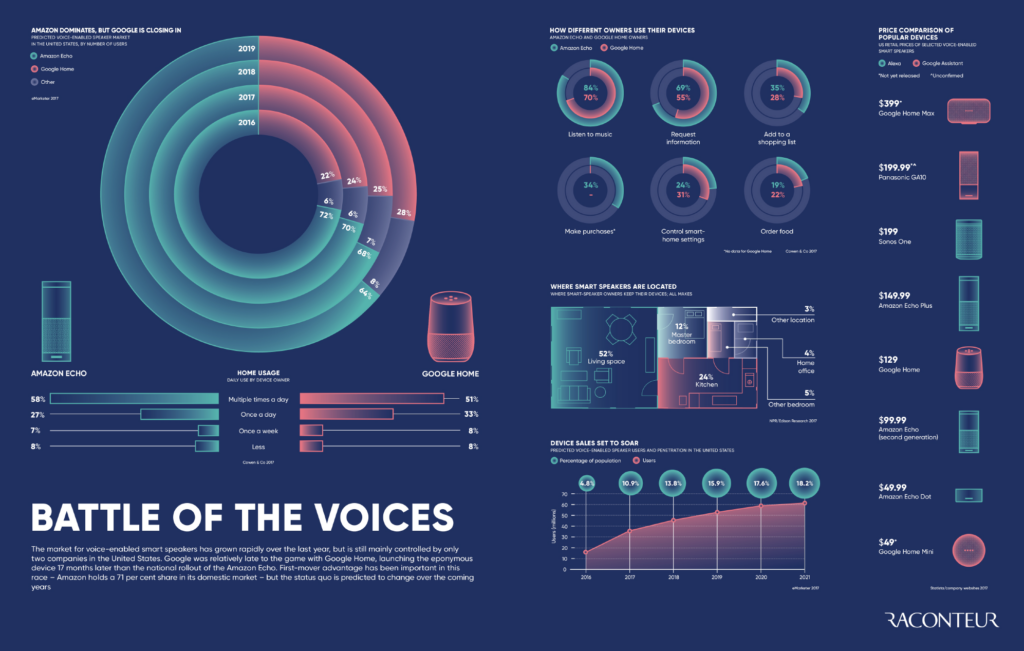
Read MoreVoice Activation [INFOGRAPHIC]
This infographic by Raconteur illustrates the competition over voice activation technology between Google and Amazon via their smart speaker products.
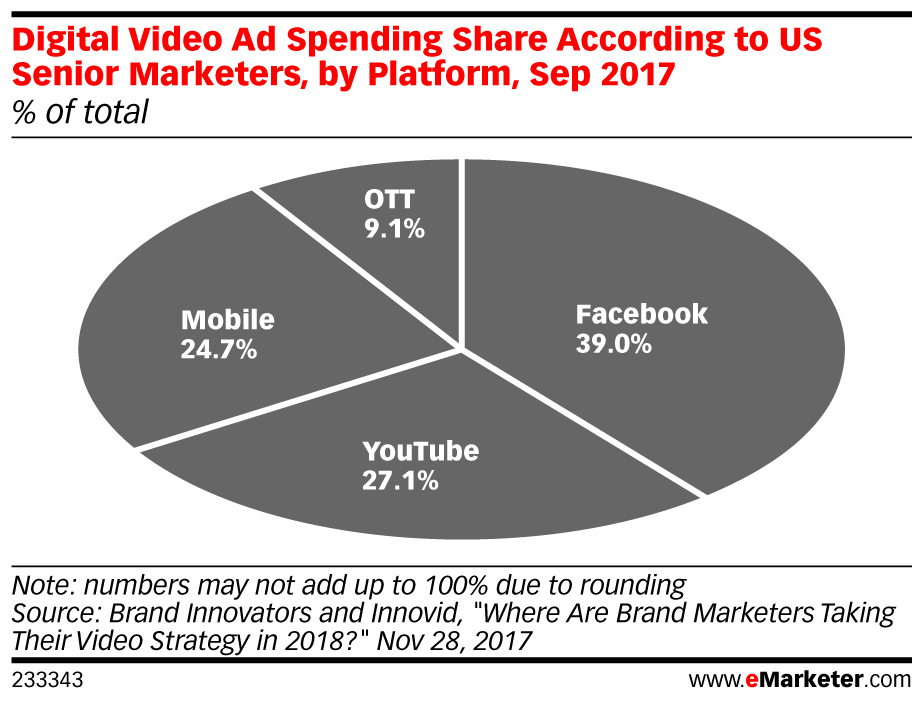
Read MoreDigital Video Ad Spending Share [CHART]
US senior marketers estimated that Facebook and Google’s YouTube together command 66.1% of digital video ad spending.
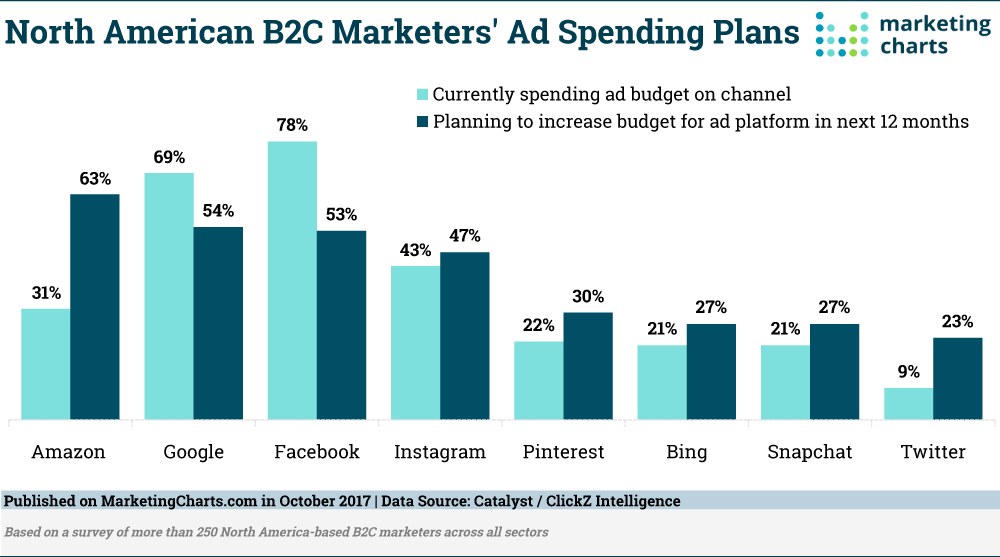
Read MoreB2C Marketers' Ad-Spending Plans [CHART]
Amazon’s US advertising revenue was expected to reach $1.65 billion in 2017 before almost doubling to $3.2 billion by 2019, at which point its ad revenues are expected to be as large as Snapchat and Twitter, combined. New survey results demonstrate that B2C marketers are taking note of Amazon’s potential in the advertising business, and that a sizable share are already advertising with the eCommerce giant.
Read MoreData Generated Per Minute By Platform [INFOGRAPHIC]
This infographic illustrates just how much data media platforms ranging from Twitter and YouTube to Netflix and Spotify generate by the minute.
Read MoreTop Global Brands In 2017 [CHART]
Apple is once again the most valuable brand in the world, keeping its hold on the top spot for the fifth consecutive year, with Google following and slightly narrowing the gap.
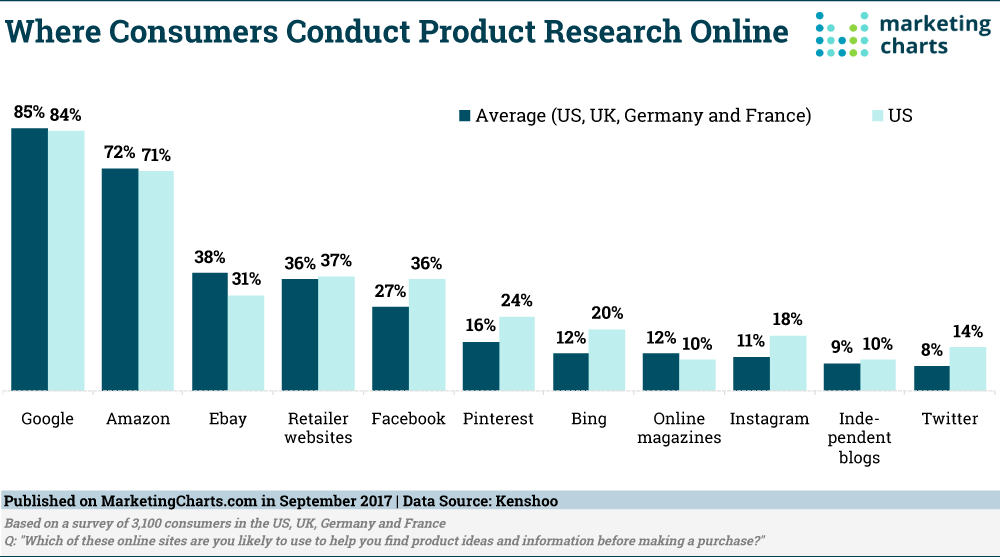
Read MoreWhere Consumers Conduct Product Research Online [CHART]
More respondents turn to Google (85%) than to Amazon (72%) to help them find product ideas and information before making a purchase.
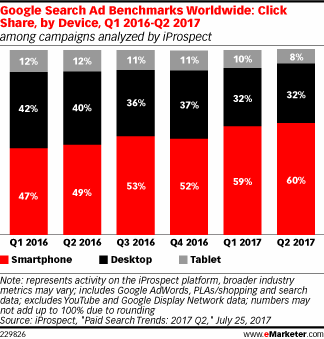
Read MoreSearch Engine Marketing Trends [PODCAST]
Despite search ads’ maturity as a format, spending on them continues to grow at double-digit rates in the US, and will continue to do so for the foreseeable future.
Read More