Posts Tagged ‘Google’
US Net Mobile Ad Revenues By Channel, 2011-2015
eMarketer revised its estimate for 2012 spending only slightly upward from the previous forecast in December 2012.
Read MoreB2B Marketing Budgets [INFOGRAPHIC]
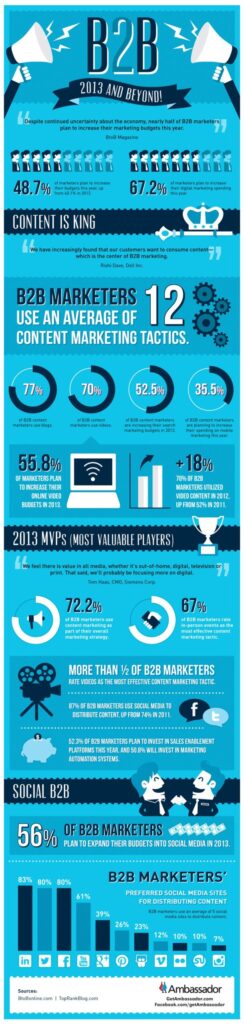
This infographic by Ambassador illustrates how B2B marketers are spending in 2013.
Read MoreClick-Through Rates For Emails That Include Social Sharing, April 2013 [CHART]
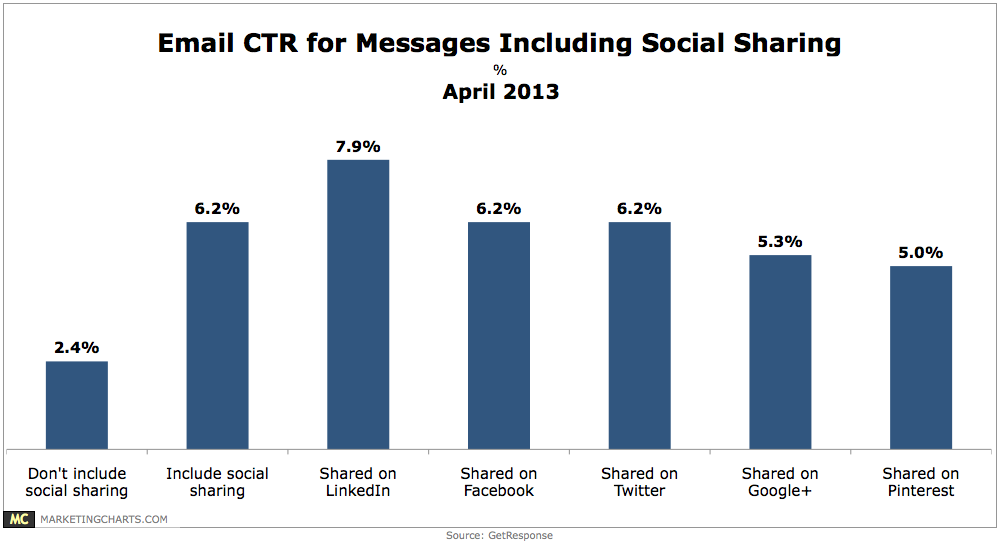
Emails that include social sharing buttons have a click-through rate 158% higher than those do not (6.2% vs. 2.4%).
Read MoreUS Online Advertising Revenue Share At Major Ad Networks, 2011-2015 [TABLE]
Yahoo!’s share of net US display ad revenues is expected to decline again this year to 7.7%, down from 9% in 2012 and 11% in 2011.
Read MoreUS Online Display Advertising Revenue Growth At Major Ad Networks, 2011-2015 [TABLE]
The 18.1% growth expected this year for US display advertising is down somewhat from more robust rates of increase in 2011 and 2011.
Read MoreOnline Display Advertising Revenues At Major Ad Networks, 2011-2015 [TABLE]
The leader of the pack is Google, with $2.26 billion in net US digital display ad revenues in 2012 and $3.11 billion expected in 2013.
Read MoreUS Search Ad Revenue Market Share, 2011-2015 [TABLE]
Google’s share of net US search ad revenues is expected to reach 73.7% this year, up from 72.8% in 2012.
Read MoreGoogle Universal Search Results By Content Type, 2012 [CHART]

A new study show the visibility of Google Shopping in Google’s Universal Search results dropped significantly after the search engine implemented a new paid inclusion model.
Read MoreGoogle's Universal Search [INFOGRAPHIC]
This infographic from Search Metrics illustrates their study of Google’s Universal Search results.
Read MoreMost Effective Social Media Channels For Small Business Owners, May 2012 vs December 2012 [CHART]
29% found LinkedIn to be effective, up from 10% in the May 2012 survey, while one-quarter saw Twitter as effective, up from 7% in the earlier survey.
Read More