Posts Tagged ‘Google’
The Evolution Of News & Social Media [INFOGRAPHIC]
This infographic by the University of Florida Online tracks the parallel evolution of major news and social media outlets.
Read MoreDaily Engagement Rate With Mobile Social Apps Among Android Users, January 2014 [CHART]
Among US Android users polled who had a Facebook app, 63% engaged with the app each day, compared with 36% engagement for those who used WhatsApp.
Read MoreTop 10 Online Video Properties, January 2014 [CHART]
The number of video views on Facebook more than tripled to 3.75 billion in December.
Read MorePeople Who Are Engaged With Brands On Social Networks, December 2013 [TABLE]
Interaction rates for Instagram posts made by the 249 prestige brands studied were some 15 times higher than those on Facebook.
Read MoreMonthly Time Spent On Social Networks, July 2013 [TABLE]
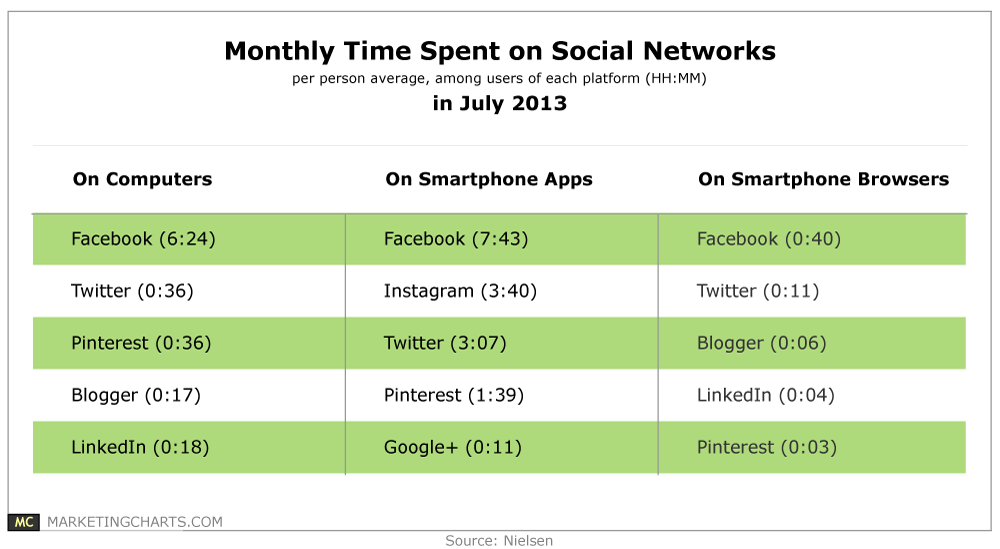
Among smartphone app users in July 2013, Instagram users were spending more time per person per month on the platform (3 hours and 40 minutes) than Twitter users (3 hours and 7 minutes).
Read MoreGoogle Suggest Results For Major Brands [INFOGRAPHIC]
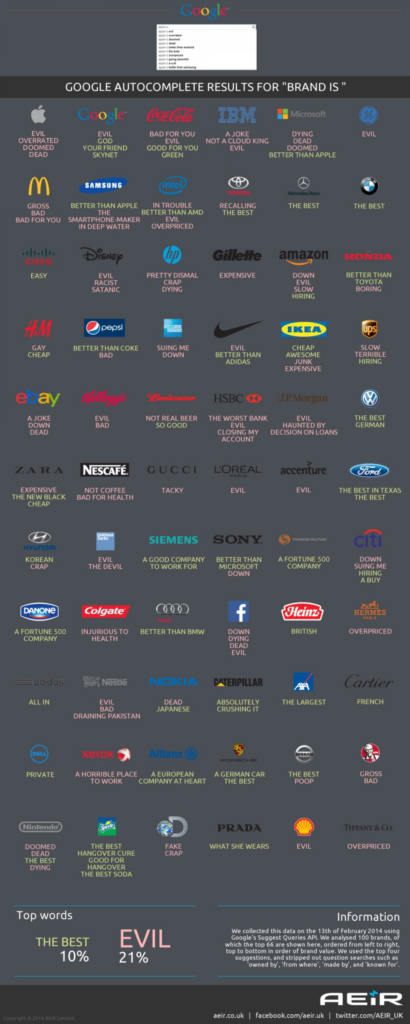
This inforgaphic by AEIR Limited illustrates Google Suggest results for Brand Is… searches for major brands.
Read MoreSocial Media Users In 2013 By Network [INFOGRAPHIC]
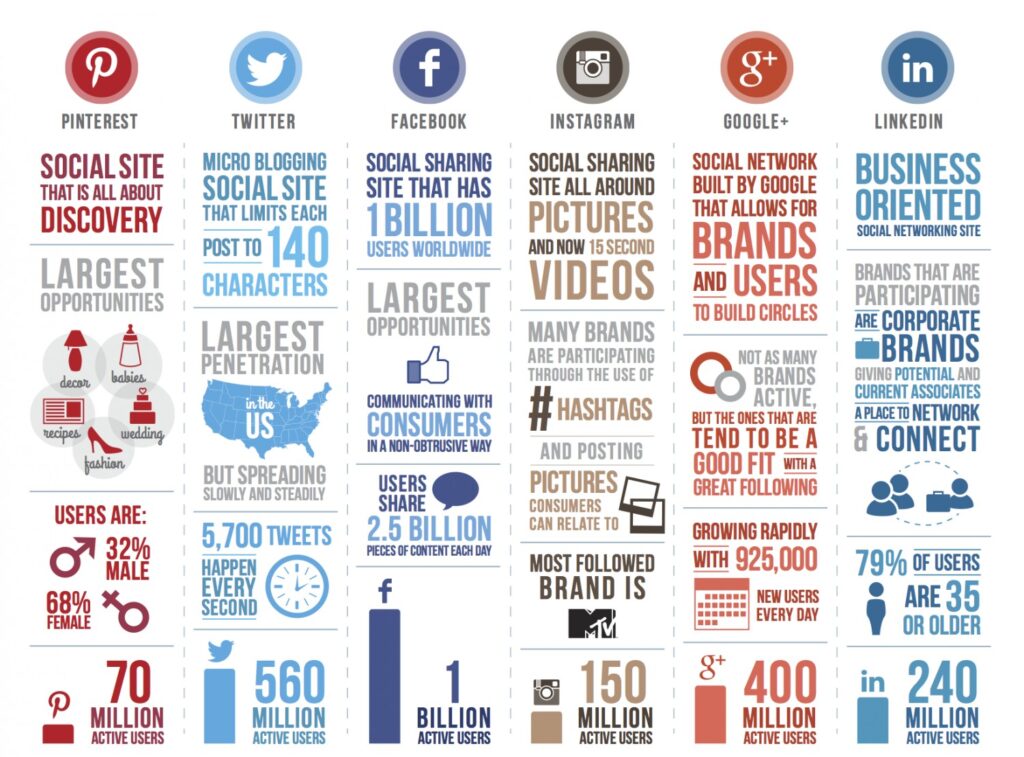
This infographic by Mark Taylor illustrates 2013 statistics for Pinterest, Twitter, Facebook, Instagram, Google+ and LinkedIn.
Read MoreSocial Login Preferences, Q2 2011-Q4 2013 [TABLE]
45.1% of social networkers worldwide entered their Facebook IDs when using social sign-in—the highest percentage.
Read MoreSocial Login Used For Select Industry Sites, Q4 2013 [CHART]
With the exception of the media/publishing sector (45%), Facebook boasted the majority of social logins for each industry included in the analysis.
Read MoreSocial Networks That Brands Promote In Their Emails, 2012 vs 2013 [CHART]
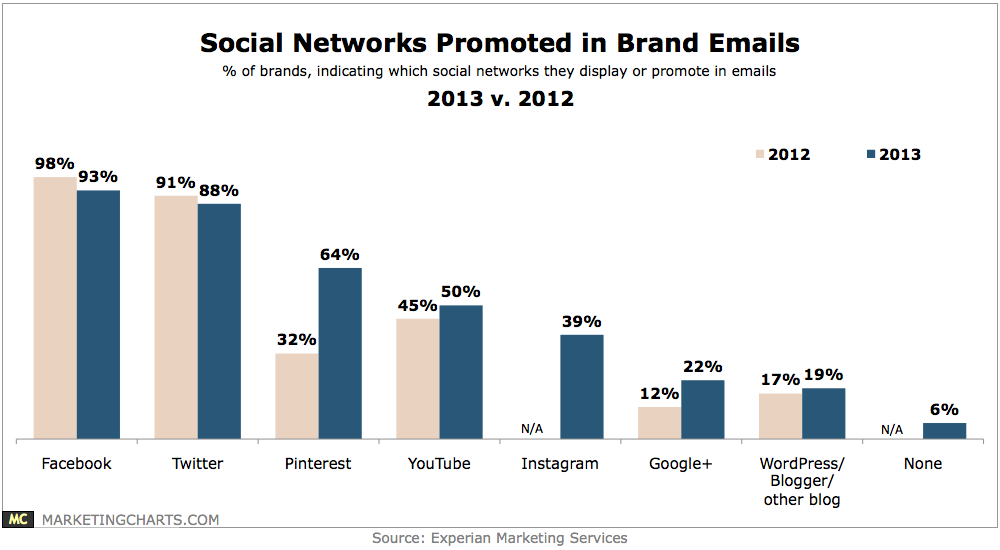
Some 94% of brands display or promote social networks in their email marketing efforts.
Read More