Posts Tagged ‘Gaming’
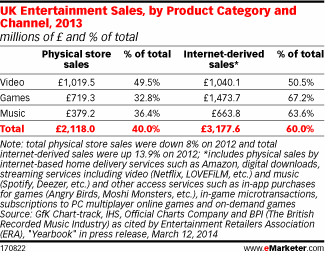
UK Entertainment Sales By Category & Channel, 2013 [TABLE]
Internet-derived sales rose 13.9% year over year in 2013 to account for 60.0% of the UK entertainment retail market.
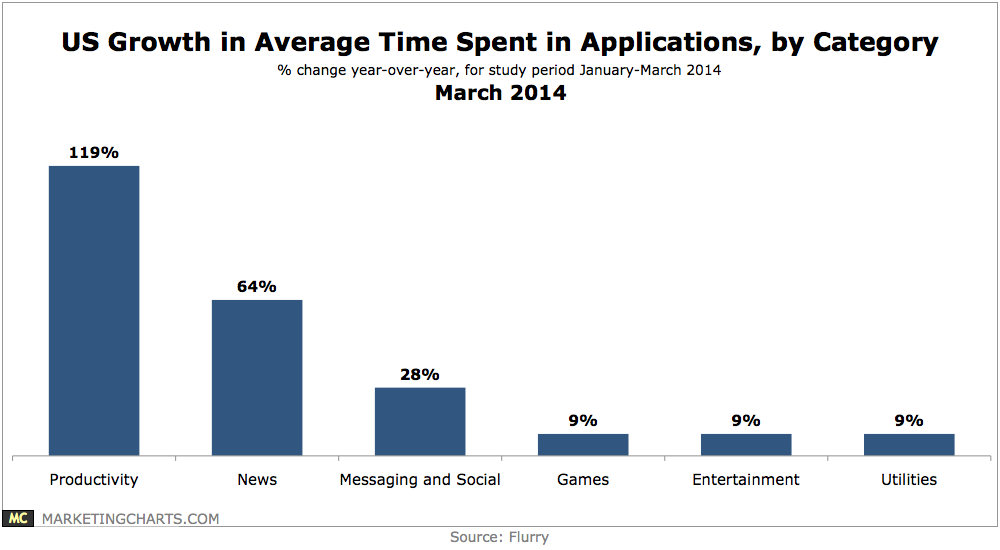
Read MoreGrowth In US Average Time Spent Using Apps By Category, March 2014 [CHART]
Average time spent in productivity apps is growing rapidly, but from a small base: the average US consumer spent 5 1/2 minutes per day in productivity apps during the Q1 study period.
Read MoreMost Common Purchases On Mobile Phones, Tablets & PCs, March 2014 [TABLE]
The vast majority of mobile phone and tablet owners have purchased products and services on their devices.
Read MoreWeekly Time Spent With Various Devices, March 2014 [CHART]
In terms of individual activities, TV is the clear-cut winner: US adults spend more than 27 hours a week watching TV.
Read MoreDevices Spaniards Use To Go Online, December 2013 [CHART]
68.9% said they had used the internet for more than 10 years, and 84.4% said they accessed the web several times each day.
Read MoreTop Website Types UK Households With Children Visit, December 2013 [CHART]
UK households with children were 26% more likely than the average household to visit information sites online.
Read MoreUK Youth Mobile Behaviour, January 2014 [TABLE]
75% of UK child and teen tablet users employed their device in order to learn things.
Read MoreMedia Consumption Channels Used By Hispanics, September 2013 [CHART]
US Hispanic adults watched more than 27 hours of television in the seven days prior to being surveyed in summer 2013, making TV their most popular media type.
Read MoreMobile Gamers' In-Game Purchase Behavior [INFOGRAPHIC]
About 50 percent of revenue comes from the top 10 percent of the players who do make purchases.
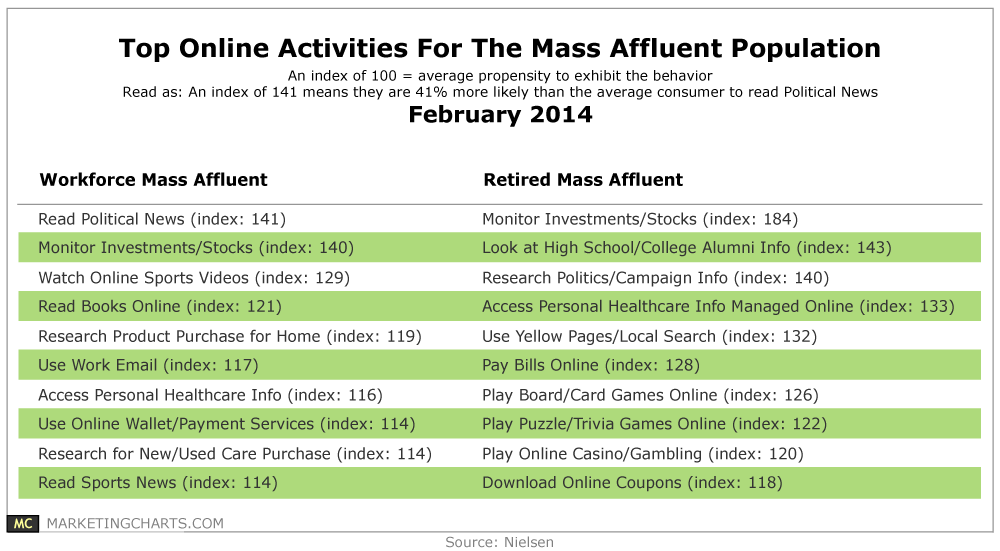
Read MoreTop Online Activities Of Mass Affluents, February 2014 [TABLE]
America’s Mass Affluent represent 12% of US households but enjoy an outsized 26% of the nation’s total wealth.
Read More

