Posts Tagged ‘Food Marketing’
Gmail Tab Delivery & Read Rates By Industry [CHART]
Gmail’s tabbed inbox seems to be having a positive influence on promotional emails’ inbox placement rates.
Read MoreEmail Inbox Placement Rate By Industry [CHART]
Deliverability rates by industry showed not only clear winners and losers, but how inconsistent inbox placement rates are when looking beyond the global average.
Read MoreOnline Purchase Plans By Category & Region, September 2014 [TABLE]
Consumers around the world tend to be more likely to shop for than buy products online, although the gap between browsing and buying is relatively small for most product categories.
Read MoreEffect Of Notifications On Opening An App By Category, July 2014 [CHART]

Mobile apps grab over half of US internet users’ time spent with digital media, and app retention and engagement are up.
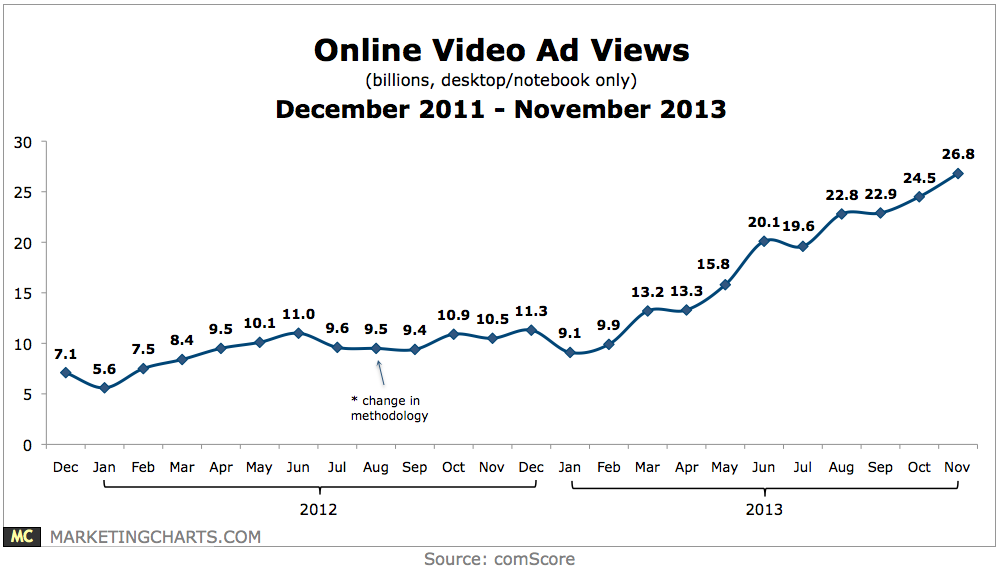
Read MoreUS Retail Sales By Category [CHART]
Americans spend $600 billion a year on groceries, the largest retail category by far. Less than 1% of those sales occur online.
Read MoreDemographics Of Online Purchasers By Product Category, June 2014 [TABLE]
Online consumers 68 and older significantly less likely than younger people to have made such purchases in multiple product categories.
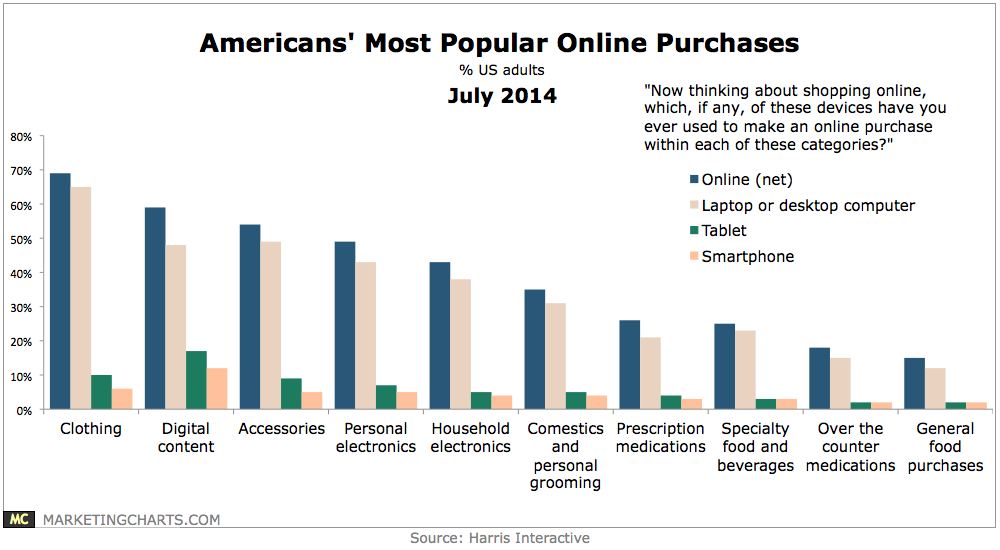
Read MoreAmericans’ Most Popular Online Purchases, July 2014 [CHART]
Almost 7 in 10 US adults have made a clothing purchase online, making this the most common purchase of 10 identified categories.
Read MoreProducts Researched Online Before In-Store Purchase By Generation, December 2013 [TABLE]

Many boomers have introduced a digital element into their shopping process, though less so than younger consumers.
Read MoreTypes Of Mobile Apps US Hispanics Use, December 2013 [TABLE]
Nearly 70% of unacculturated US Hispanic internet users reported that a social media app was one of their top three used apps.
Read MoreInstagram Penetration Among Social Brands By Industry, March 2014 [CHART]
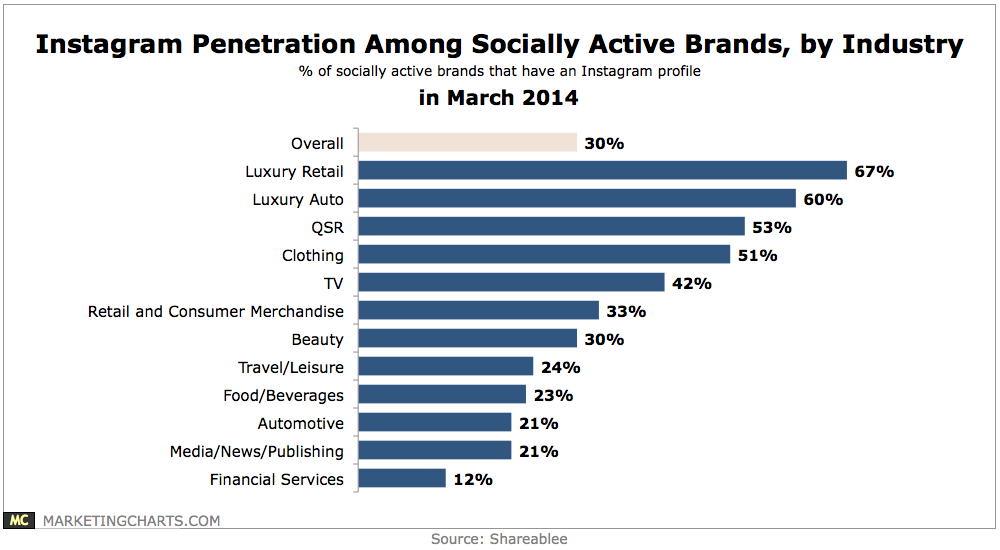
Some 30% of socially active brands have an Instagram profile as of March 2014.
Read More