Posts Tagged ‘Fitness Marketing’
Ad Viewability Benchmarks By Site Type, 2012 [CHART]
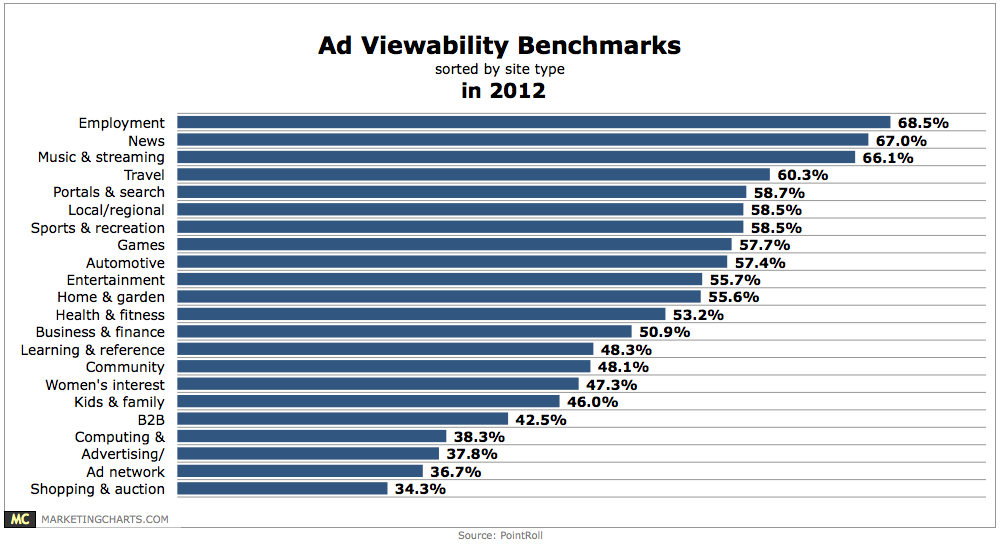
Covering 2012 activity, the data shows that viewability rates were lowest on shopping and auction (34.3%) and ad network (36.7%) sites, and highest on employment (68.5%), news (67%) and music and streaming media (66.1%) sites.
Read MoreMultiscreen Behavior With Facebook & Twitter By Gender, March 2013 [CHART]
Women were slightly more likely than men to turn to social media while watching TV, traveling and exercising, and significantly more likely to do so while shopping.
Read MoreMultiscreen Behavior With Facebook & Twitter, March 2013 [CHART]
More than eight in 10 Facebook users and about two-thirds of Twitter users used social networks while channel surfing.
Read MoreImportance Of Buying American By Product Category & Gender, March 2013 [CHART]
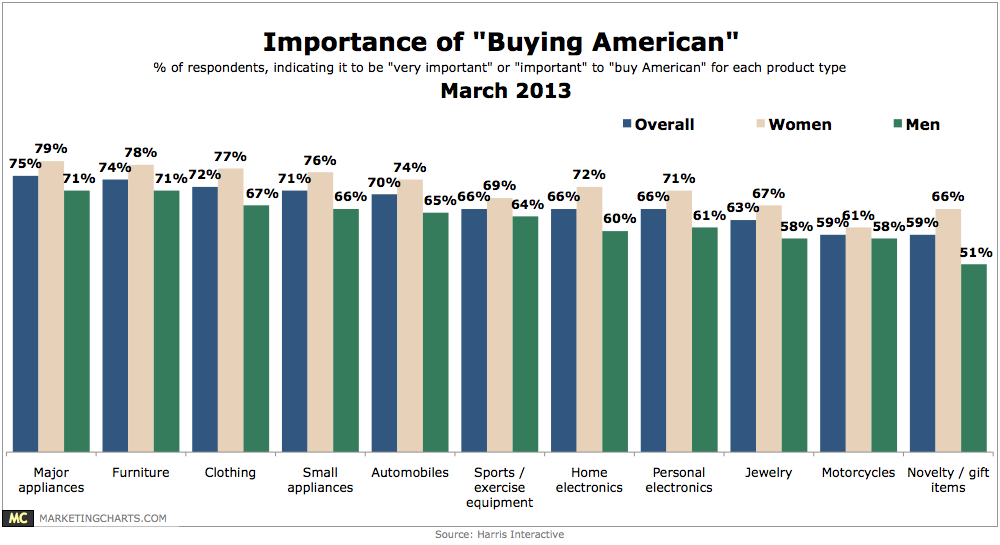
Women were 11% more likely to consider Buying American important when purchasing major appliances (79% vs. 71%).
Read MoreTypes Of Health Information Sought Online By Generation & Gender, September 2012 [TABLE]
16% of internet users said they had searched for information on a drug they had seen advertised.
Read MoreVideo Games Or Gym Memberships? [INFOGRAPHIC]
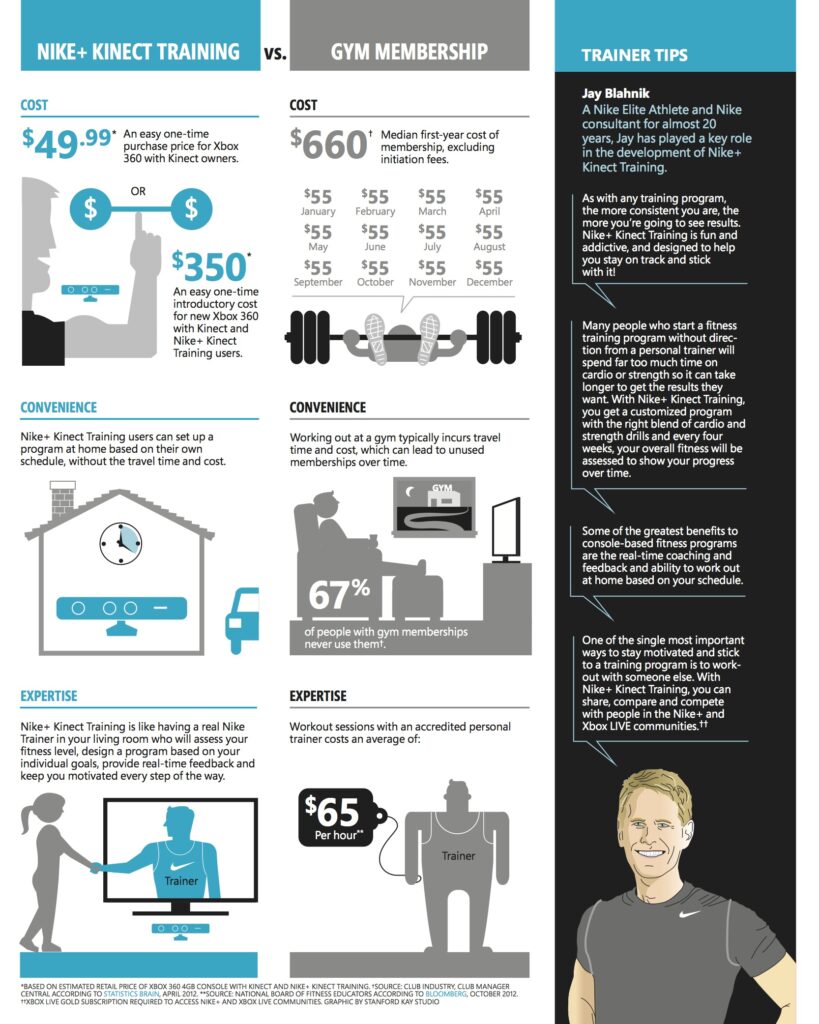
Nike+Kinect video game producers put together this infographic to illustrate the costs of working out at home by playing a video game vs buying a gym membership.
Read MoreActivities Mobile Users Expect To Do Via Their Device By Demographic, October 2012 [CHART]
Banking is top of mind for smart device owners who are increasingly using mobile to accomplish the daily to-do list.
Read MoreMobile Device Use For New Year's Resolutions By Gender, December 2013 [CHART]
The resolutions people were most likely to seek aid for on smart phones were everyday challenges: being on time, keeping in touch, budgeting, reading more and counting calories.
Read MoreGoogle Ad Conversion Rates By Industry, Q3 2012 [CHART]
Of the 10 industries that spent the most on Google ads in Q3 2012, the Internet and Telecommunications industry achieved the best overall results.
Read MoreHow Google Makes $100 Million A Day [INFOGRAPHIC]
This infographic by WordStream breaks down Google’s daily ad revenue.
Read More