Posts Tagged ‘Financial Services Marketing’
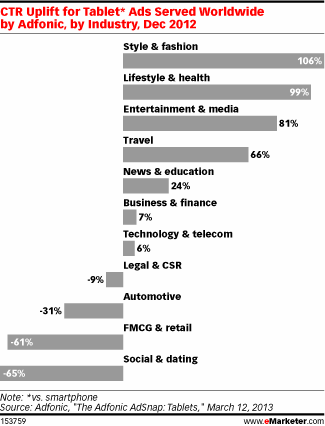
Tablet Ad Click-Through Rate Uplift By Industry, December 2012 [CHART]
Click-through rates for entertainment and media, as well as the travel category rose by 81% and 66%, respectively.
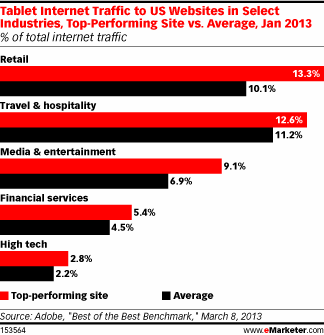
Read MoreTablet Traffic To US Websites Of Select Industries, January 2013 [CHART]
The top-performing retailer site studied got 13% of internet traffic from tablets.
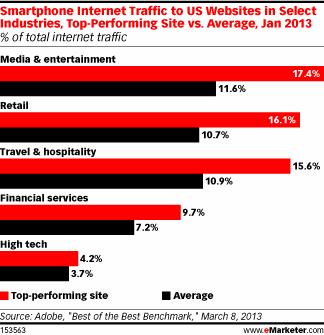
Read MoreUS Smart Phone Website Traffic To Select Industry Websites, January 2013 [CHART]
The top-performing site that got the greatest share of traffic from smart phones was in the media and entertainment category.
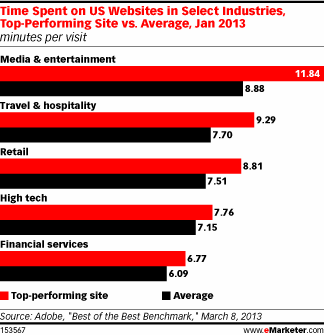
Read MoreTime Spent On US Websites By Select Industries, January 2013 [CHART]
The top-performing media and entertainment site kept users on the site for about 12 minutes per visit.
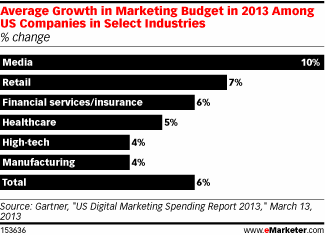
Read MoreAverage Marketing Budget Growth In 2013 For Select US Industries [CHART]
For 2013, marketers are expecting to increase overall marketing budgets by an average of 6%.
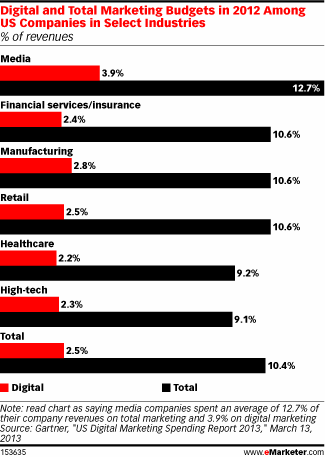
Read MoreOnline vs. Total Marketing Budgets In 2012 For Select Industries [CHART]
On average, companies spent 10.4% of revenues on marketing activities in 2012. Of that budget, 2.5% of total revenues were spent on digital media initiatives.
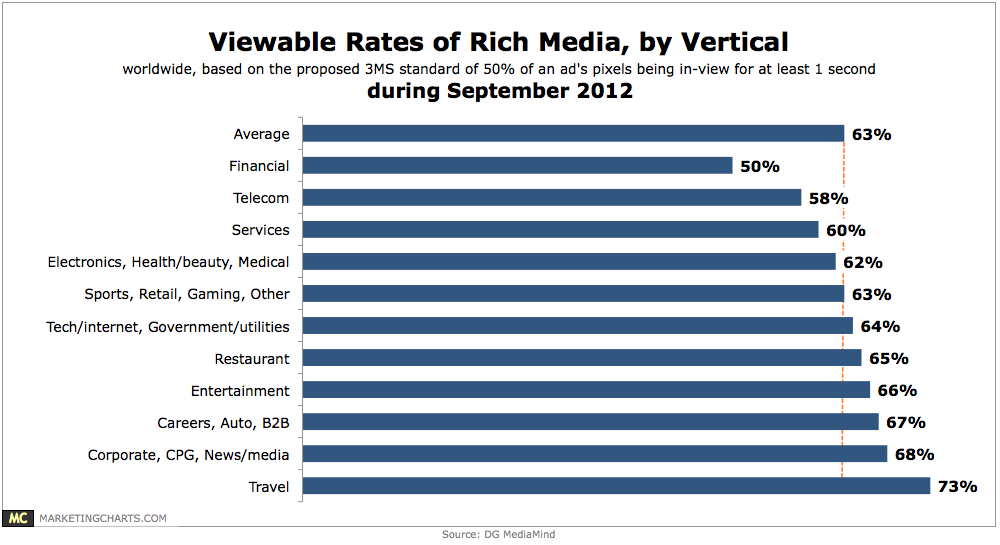
Read MoreRich Media Viewability By Vertical, September 2012 [CHART]
63% of rich media ads are viewable.
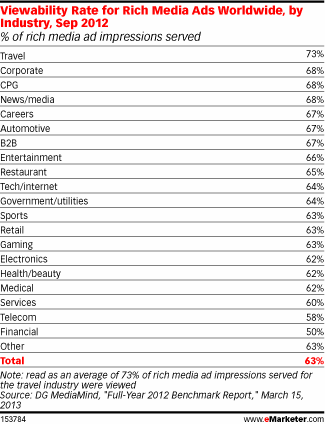
Read MoreViewability Rate For Rich Media Ads By Industry, September 2012 [TABLE]
Rich media ads purchased by firms in the travel industry were most likely to be viewable, at 10 percentage points above average, while those in the financial vertical were only seen half the time.
Read MoreOnline Marketing Success Factors [CHART]
Design, development and maintenance of the corporate website was cited by 45% of respondents as contributing to marketing success.
Read MoreTop 10 Advertising Sectors In 2012 [CHART]
At roughly $16.3 billion – up 3% from $15.9 billion in 2011 – the retail sector accounted for more than 11% of total US ad spend (excluding FSI/PSA).
Read More