Posts Tagged ‘eTailing’
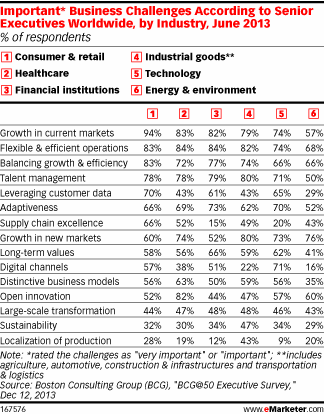
Top Business Challenges According To Senior Execs By Industry, June 2013 [TABLE]
70% of retail executives and 65% of technology leaders saw obstacles in leveraging consumer data.
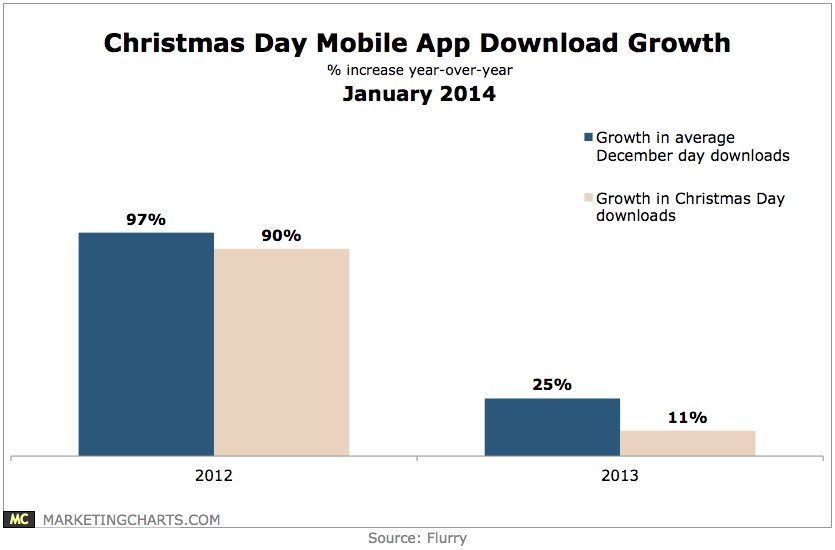
Read MoreChristmas Day Mobile App Downloads Growth, January 2014 [CHART]
Christmas Day app downloads grew by 91% compared to the first 21 days of December, reaching a record-breaking level.
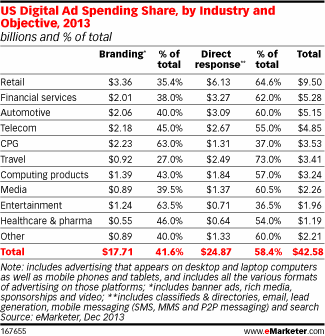
Read MoreUS Online Ad Spending Share By Industry & Objective, 2013 [TABLE]
Spending by some verticals—including travel and retail—skewed much more heavily toward direct-response advertising.
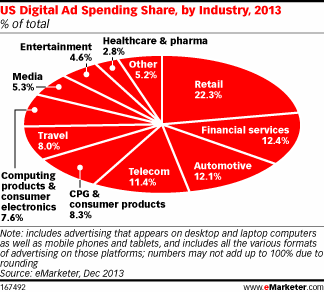
Read MoreUS Online Ad Spending Share By Industry, 2013 [CHART]
Between 2012 and 2017, investment in online and mobile paid media will increase from $36.80 billion to $62.83 billion, for a compound annual growth rate of 11.3%.
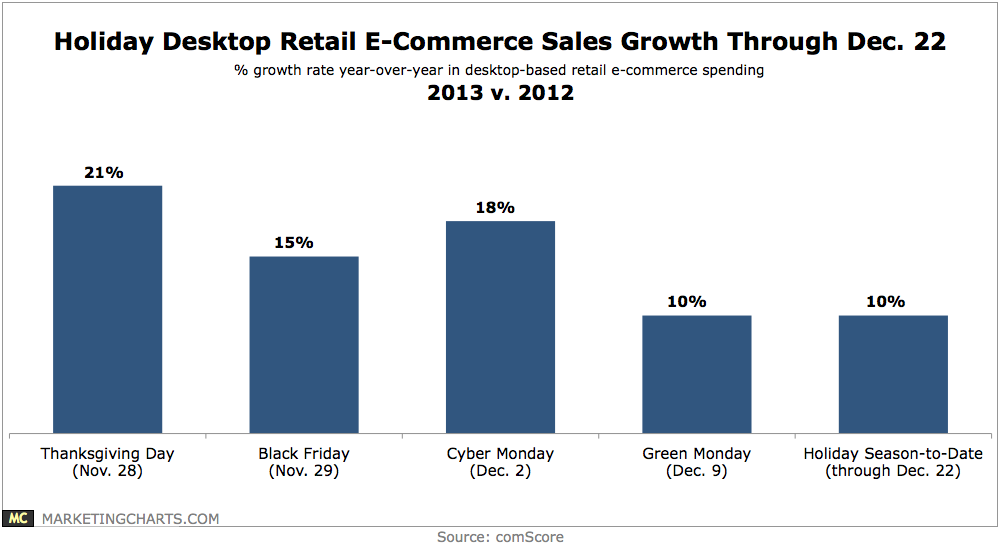
Read MoreHoliday Desktop eCommerce Sales Growth Through December 22, 2012 vs 2013 [CHART]
The growth rate for the holiday season through December 22nd stood at 10%. Even so, IBM reports a robust 16.5% increase in online sales on Christmas Day.
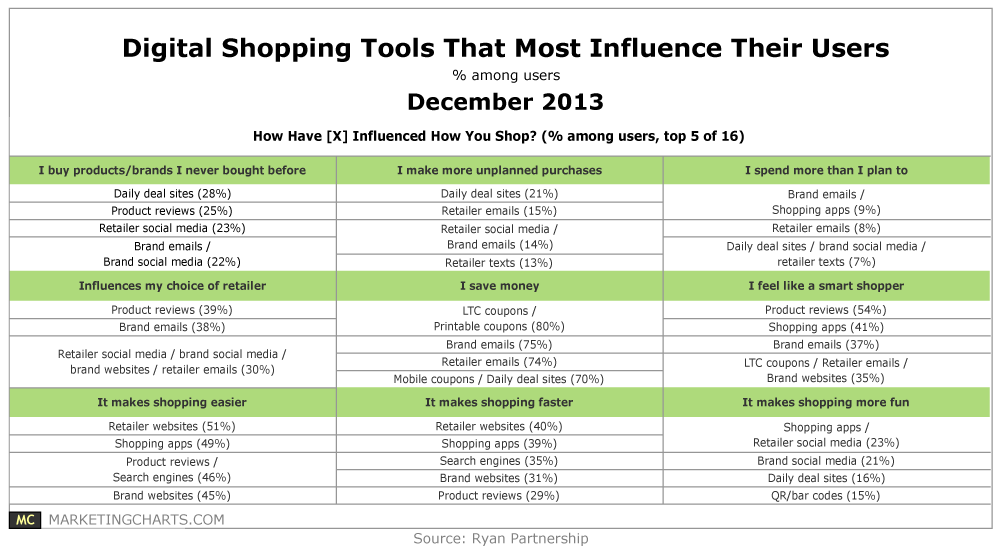
Read MoreDigital Shopping Tools That Most Influence Their Users, December 2013 [TABLE]
At least 8 in 10 respondents are aware of traditional tools such as retailer websites (86%), search engines (84%), and printable coupons (81%), with newer tools such as mobile coupons (59%), shopping apps (54%) coming on strong.
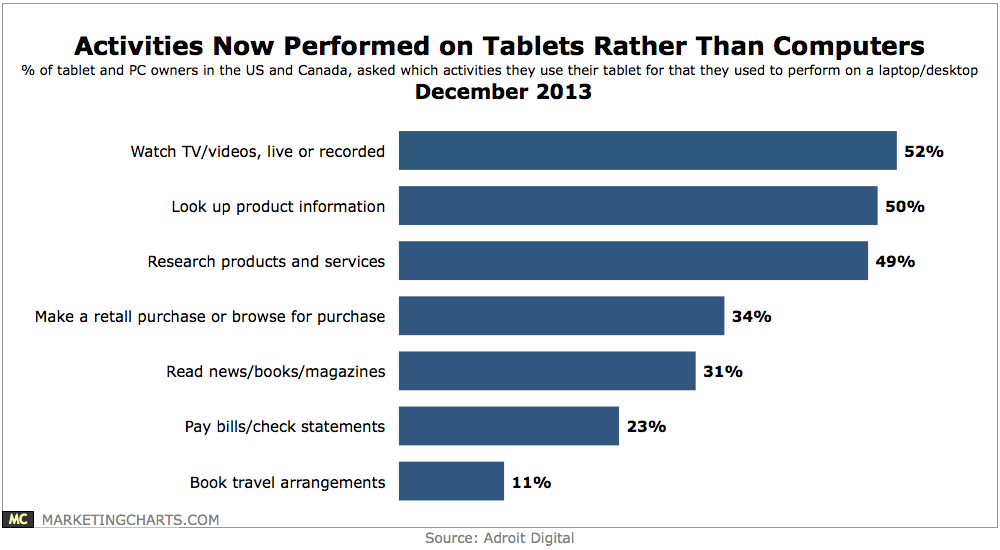
Read MoreComputer Activities Now Performed On Tablets, December 2013 [CHART]
55% of respondents who own both devices would consider purchasing a tablet as a replacement for their personal laptop or desktop.
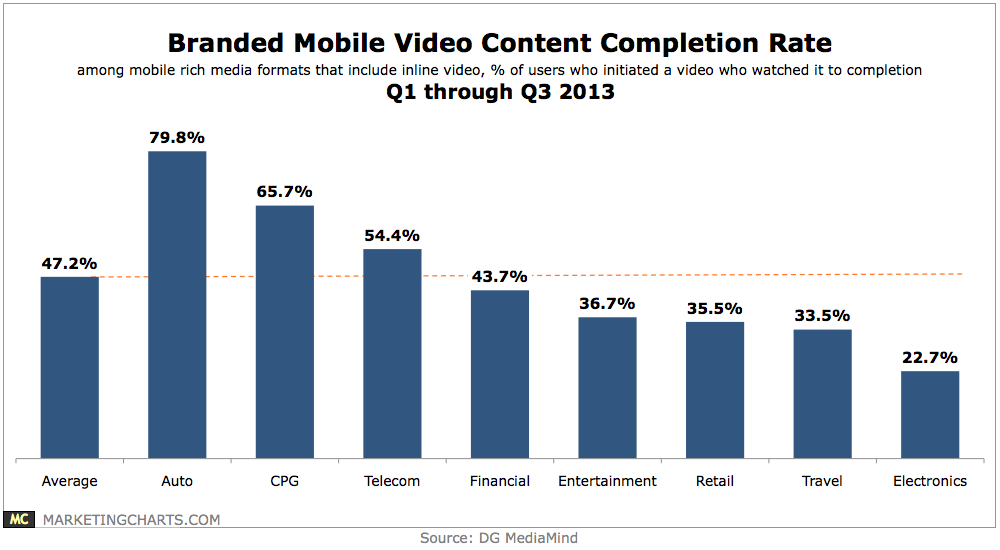
Read MoreBranded Mobile Video Content Completion Rates, Q1 – Q3 2013 [CHART]
47.2% of branded videos initiated by users were watched to completion, with that figure highest for auto (79.8%), CPG (65.7%) and telecom (54.4%) advertisers.
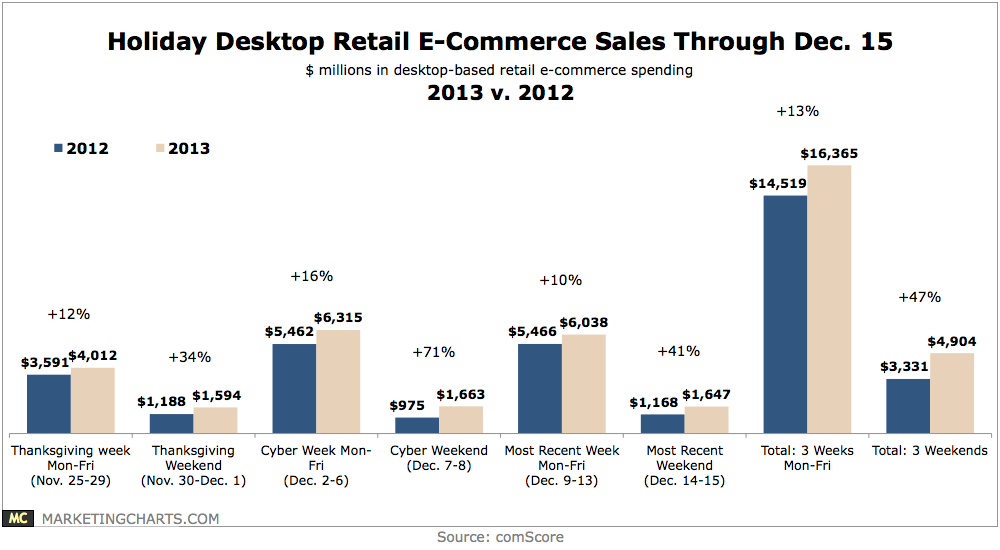
Read MoreHoliday Desktop Retail eCommerce Sales Through December 15, 2012 vs 2013 [CHART]
Mobile shopping may be on the rise this holiday season, but that doesn’t appear to be affecting desktop e-commerce sales.
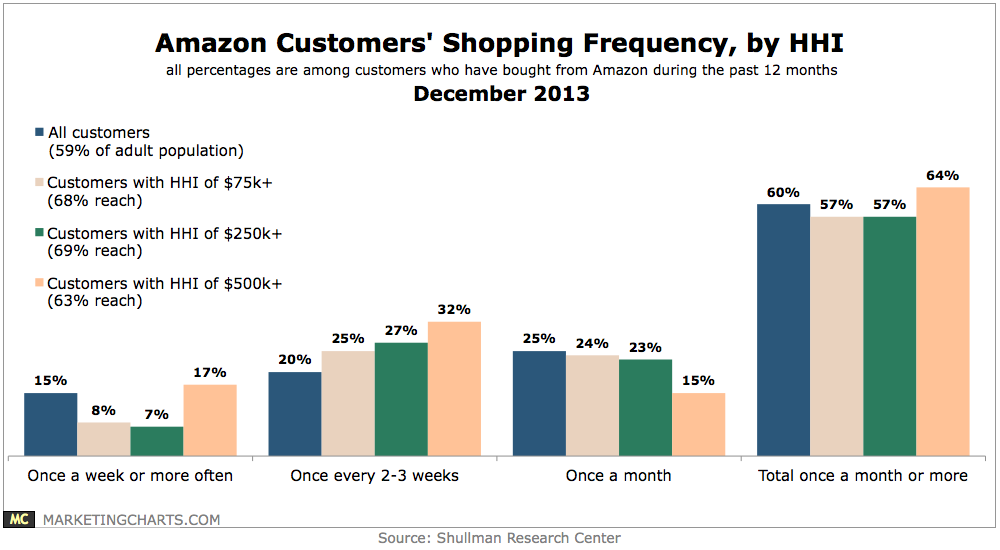
Read MoreAmazon Customers' Shopping Frequency By Household Income, December 2013 [CHART]
Amazon customers’ average household income is roughly $89,000, compared to the $71,000 average for the US as a whole.
Read More