Posts Tagged ‘eTailing’
Products/Services Bought On Smart Phone By European Shoppers, March 2013 [CHART]
The top categories of products purchased through smart phones included clothes and accessories, books, electronics and appliances, and tickets.
Read MoreUS Retail eCommerce Sales Share, 2009-2013 [CHART]
eMarketer estimates that eCommerce sales capture only 5.78% of total retail sales in the US, but they influence a much higher percentage.
Read More7 Types Of American Smart Phone Users [TABLE]
Experian Marketing Services has released a report segmenting US smartphone owners into 7 groups.
Read MoreRetail Sector Customer Satisfaction Rates, 2012 vs 2013 [CHART]
While e-commerce sites have generally enjoyed higher levels of customer satisfaction than traditional retail stores, the gap has disappeared for the time being.
Read MoreAd Performance Lifts From Top Audiences, Q4 2013 [CHART]
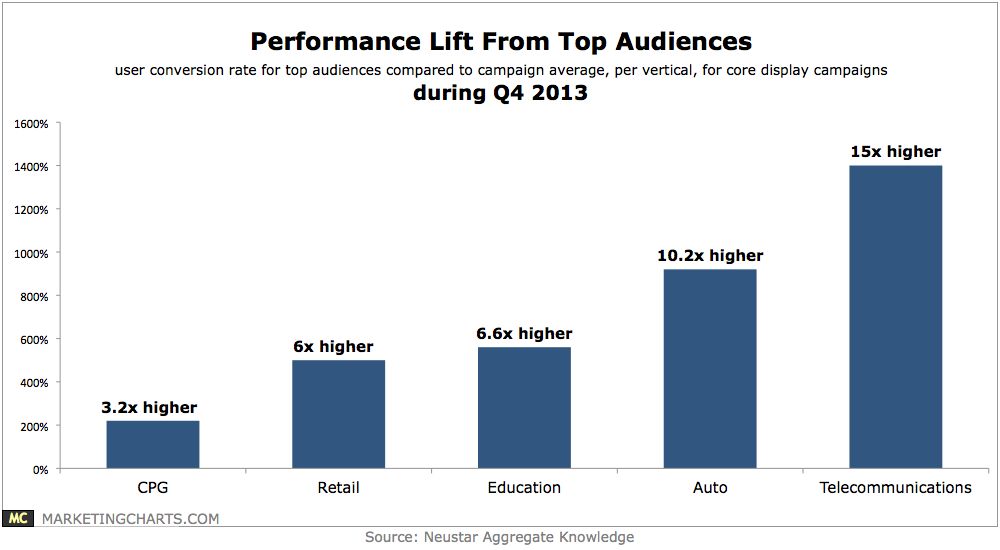
Targeting top audiences leads to a performance lift of 220%.
Read MoreTop Retail Site Load Speeds, February 2014 [CHART]
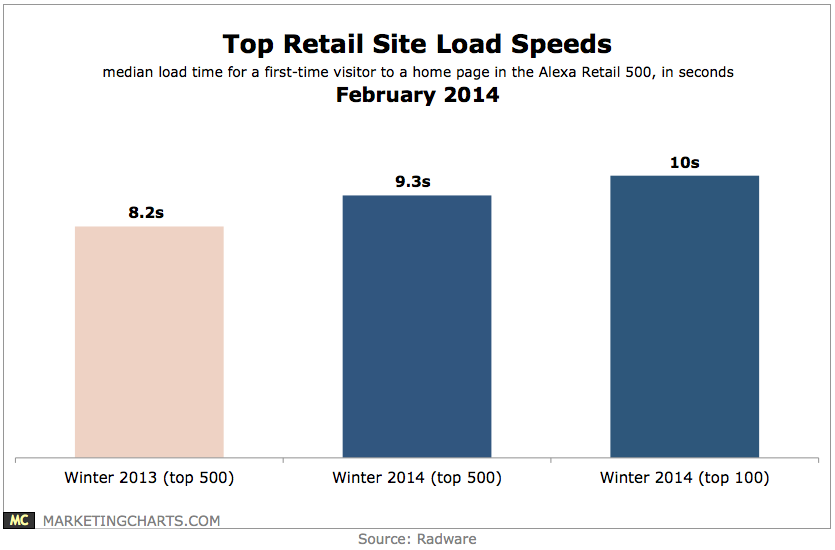
The median load time for home pages of the top 500 US retail websites (as ranked by Alexa) continues to slow down, clocking in at 9.3 seconds during the Winter period, 21% slower than the 7.7 seconds from a year earlier.
Read MoreTop Secondary Actions After Clicking On A Local Mobile Ad, 2013 [TABLE]
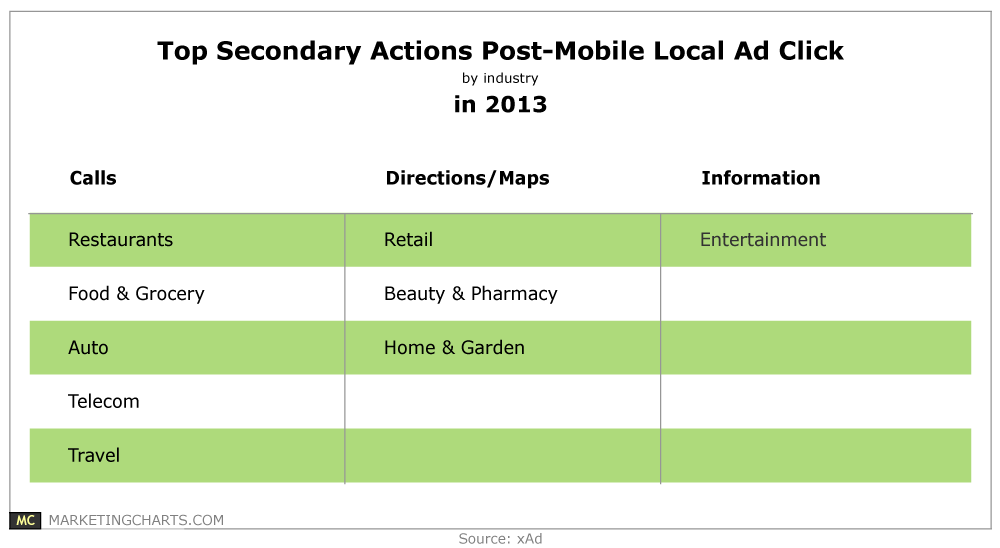
What happens after a mobile users clicks on a locally-targeted ad? Most often, a phone call to the business.
Read MoreWhere Millennials Make Purchases After Seeing Products On Social Sites, Fall 2013 [CHART]
Nearly eight in 10 millennial internet users who made a purchase after seeing an item on Facebook shopped both online and in-store.
Read MoreProduct Category Purchased By Millennials After Sharing On Social, Fall 2013 [TABLE]
US millennial internet users flocked to different social networks to post about different types of products they wanted to buy.
Read MoreTop Online Activities Of Mass Affluents, February 2014 [TABLE]
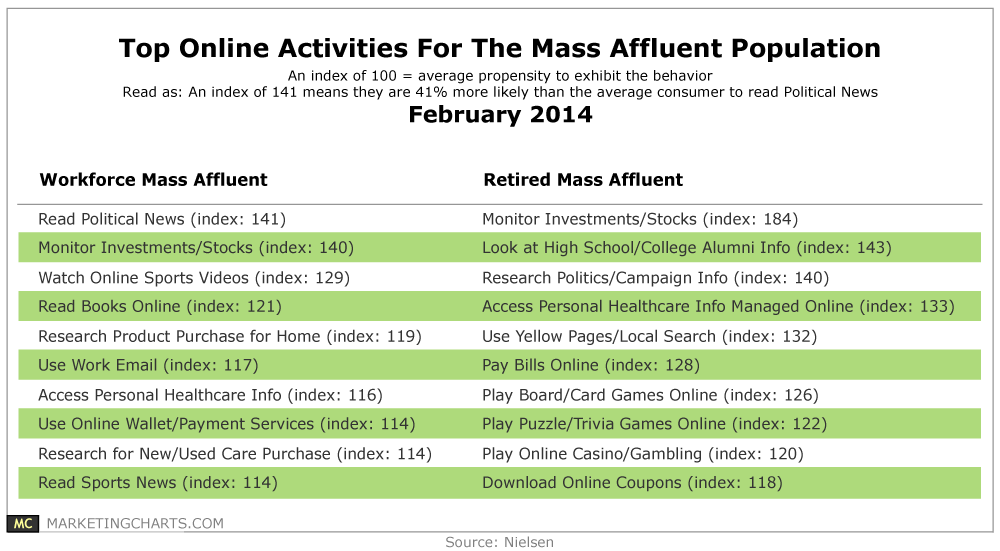
America’s Mass Affluent represent 12% of US households but enjoy an outsized 26% of the nation’s total wealth.
Read More