Posts Tagged ‘Entertainment Marketing’
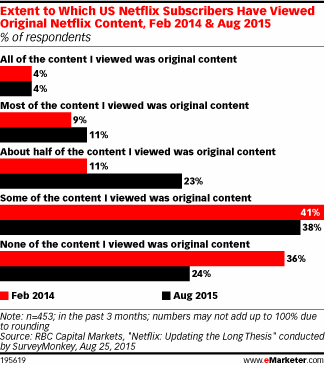
Netflix Original Content Consumption, 2014 vs 2015 [CHART]
Between February 2014 and August 2015, the share of US Netflix users who didn’t watch any original content dropped by one-third.
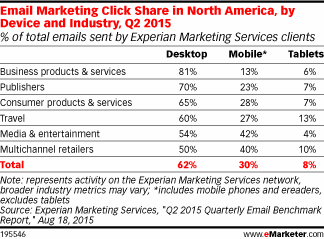
Read MoreMarketing Email Click Share By Industry, Q2 2015 [TABLE]
On average, 62% of clicks happened on the desktop—14 percentage points ahead of the desktop share of opens.
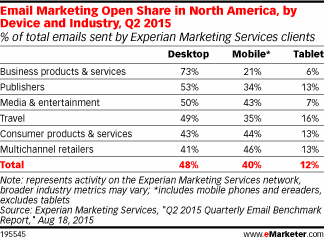
Read MoreMarketing Email Open Share By Industry, Q2 2015 [TABLE]
Overall, 48% of all marketing emails sent by Experian clients were opened on the desktop,
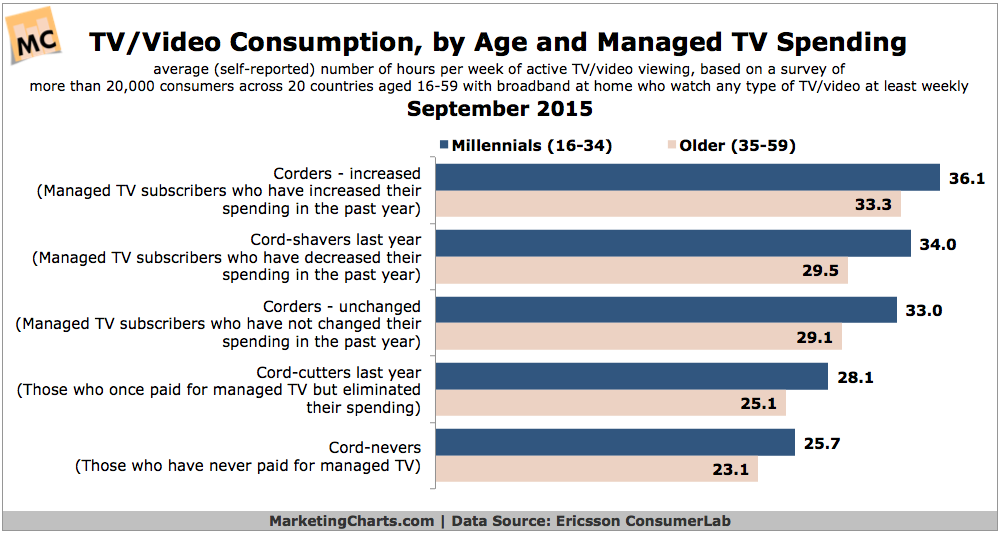
Read MoreMillennials' TV/Video Consumption, September 2015 [CHART]
Various pieces of research have suggested that consumers who stream video do so to complement their traditional TV viewing, rather than entirely replace it.
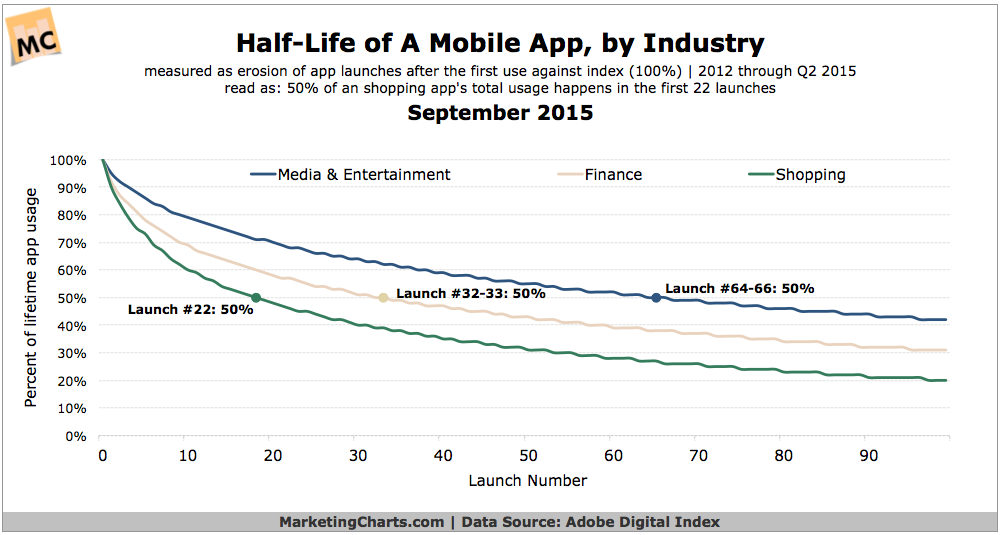
Read MoreHalf-Life Of Media/Entertainment, Finance & Shopping Apps, September 2015 [CHART]
Media and entertainment applications have a slower attrition rate than financial and shopping apps.
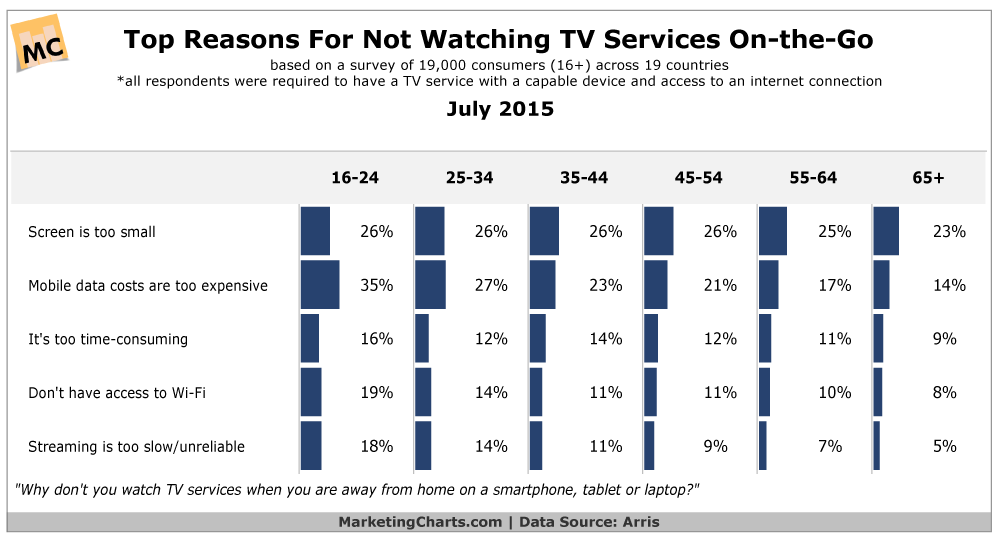
Read MoreTop Reasons People Don't Watch Mobile TV, July 2015 [CHART]
Mobile TV – defined as watching TV services while away from home on a smartphone, tablet or laptop – is growing in frequency.
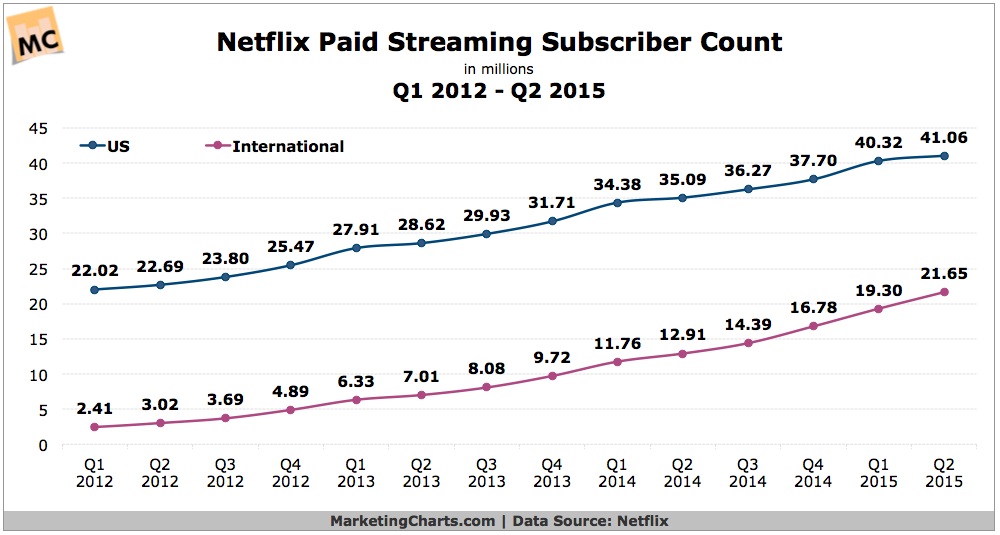
Read MoreNetflix Subscriber Growth, 2012-2015 [CHART]
Netflix turned in another strong quarter in Q2, the company said in a recent release, gaining more than 2 million paid international subscribers.
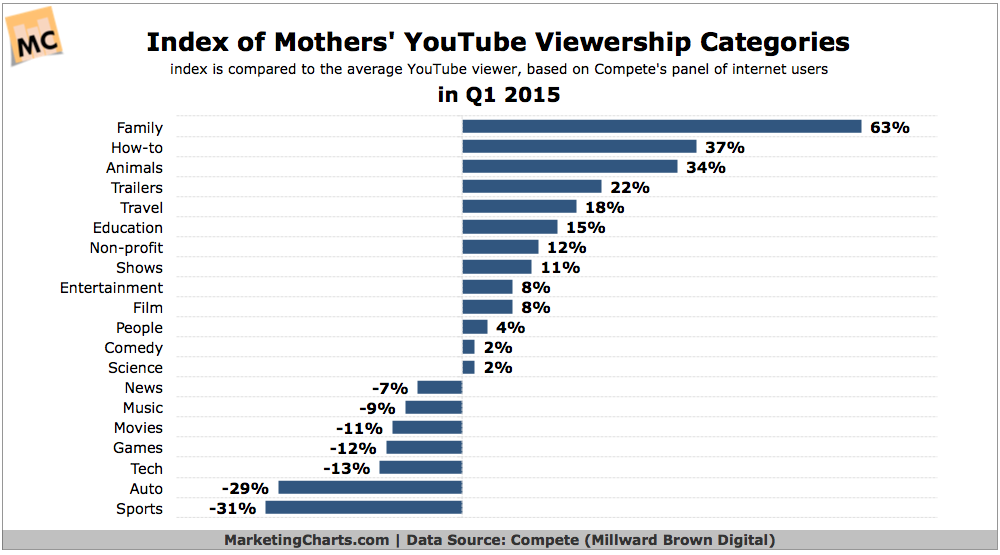
Read MoreMothers' YouTube Video Preferences, Q1 2015 [CHART]
Mothers are avid viewers of YouTube videos, being slightly more likely than the overall internet browsing population to visit YouTube on a monthly basis.
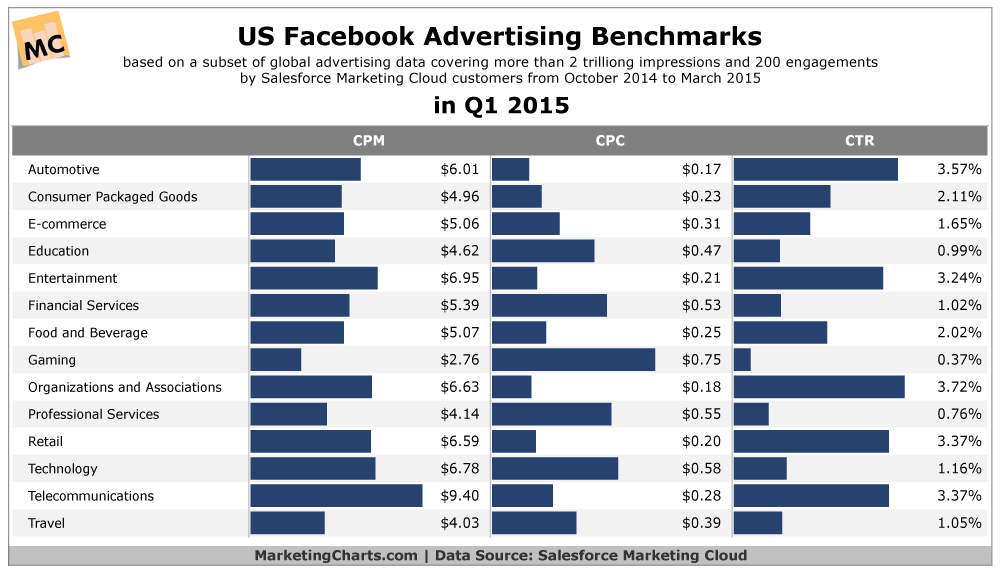
Read MoreFacebook Advertising Benchmarks, Q1 2015 [CHART]
Facebook advertising CPMs were highest for the telecommunications industry and lowest for the gaming vertical in Q1 2015.
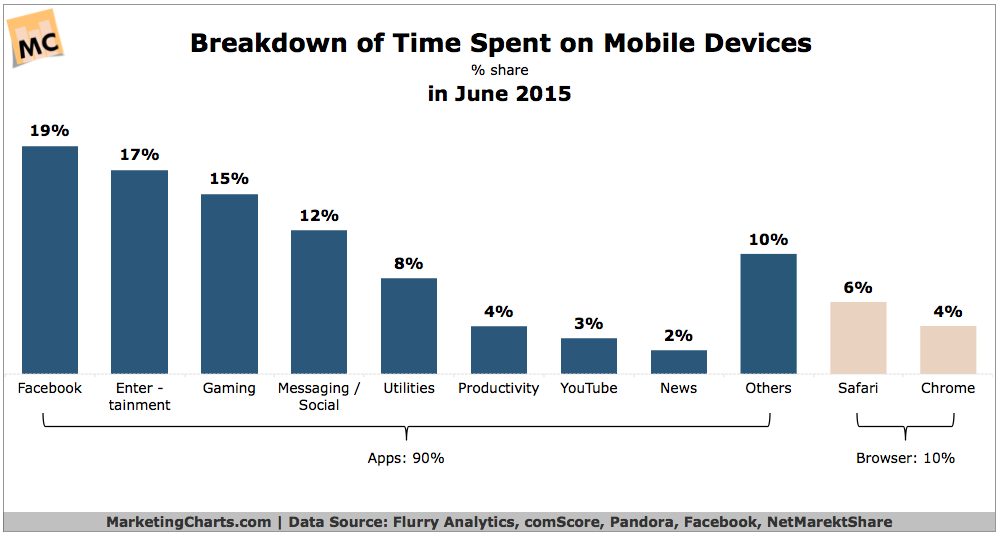
Read MoreTime Spent On Mobile Devices – Apps vs Browser, June 2015 [CHART]
Apps continue to dominate US time spent with mobile, reaching 90% of mobile minutes in June 2015, up from 86% share in Q2 2014.
Read More