Posts Tagged ‘Entertainment Marketing’
Television Consumption By Device, June 2013 [CHART]
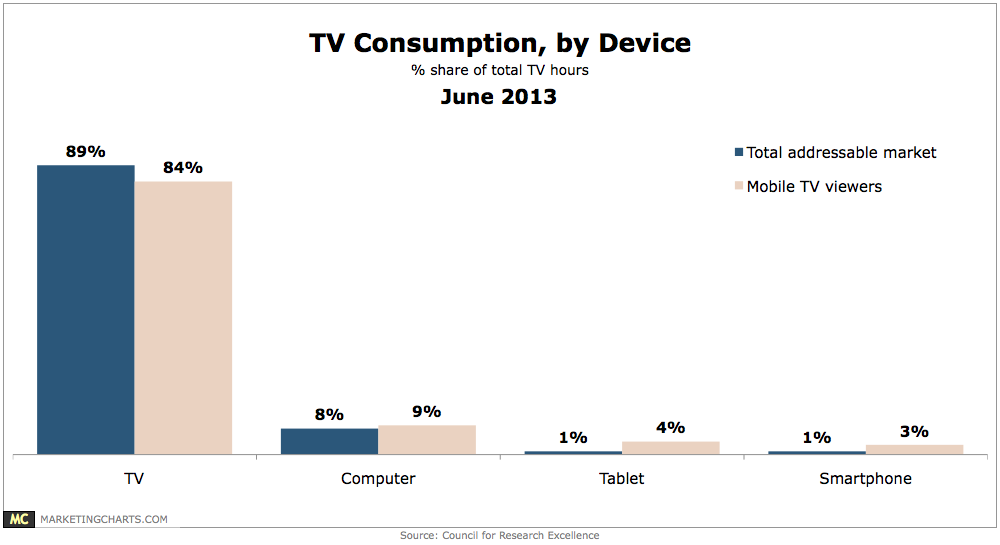
Just 2% of all TV hours logged were on tablets (1%) or smart phones (1%).
Read MoreTwitter & Nielsen Team Up For Second Screen Data Analysis [VIDEO]

Beyond Social Media hosts discuss social TV & the Twitter/Nielsen partnership to understand second screen behavior and behaviorally-targeted advertising.
Read MoreUS Online Ad Spending Growth By Industry, 2011-2017 [TABLE]
Four of the six industries growing their digital ad spending at or above overall market rates are retail, financial services, consumer packaged goods & travel.
Read MoreOnline Streaming Habits, May 2013 [TABLE]
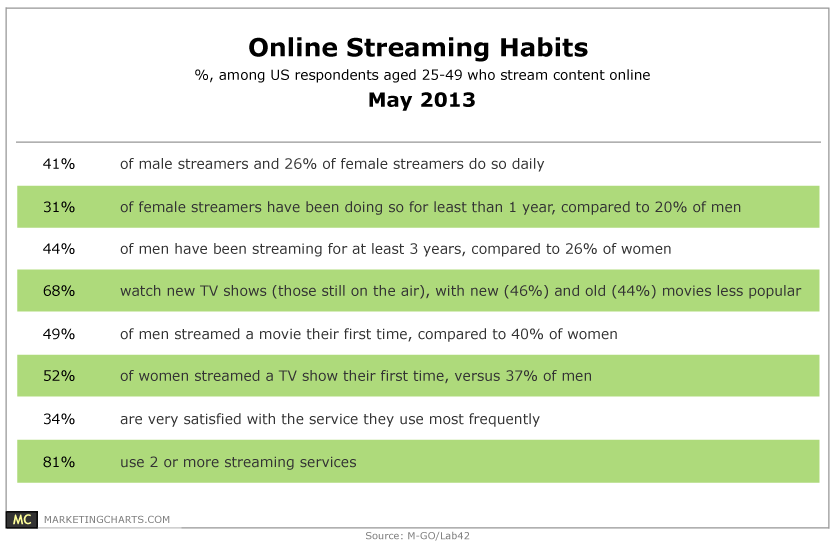
A survey from M-GO of streaming media consumers finds that new TV shows are their most popular type of programming, cited by 68% of respondents, with new movies (46%) and older movies (44%) in tow.
Read MoreMoms' Social Sharing By Content Type, May 2013 [CHART]
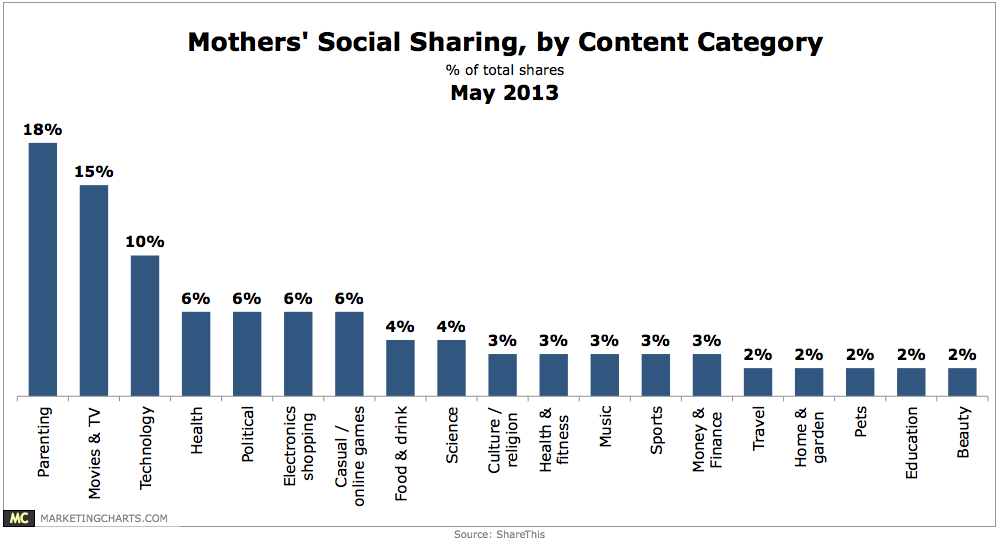
30% of mothers shared content on the ShareThis network during the period, compared to 10% of the network’s overall average.
Read MoreTop 5 TV-Related Social Media Activities, May 2013 [CHART]
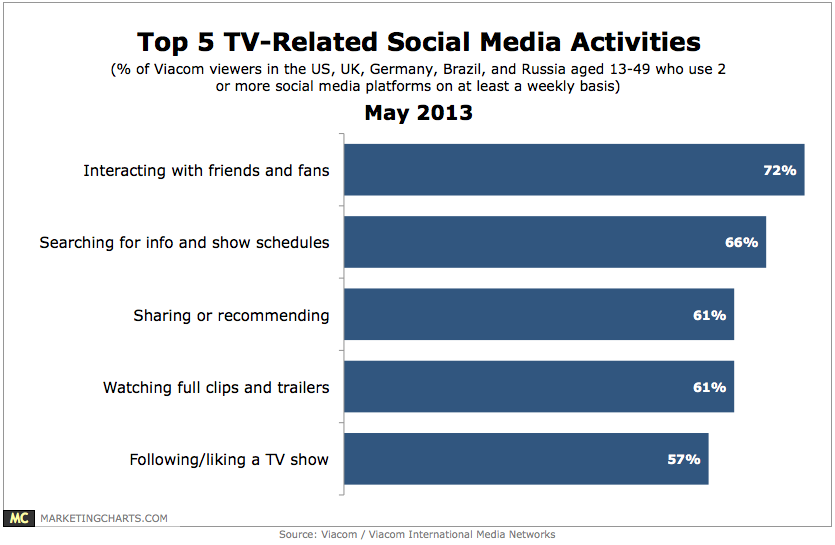
Viewers average 10 TV-related activities on social media on a weekly basis.
Read MoreAmericans & On Demand Entertainment, May 2013 [TABLE]
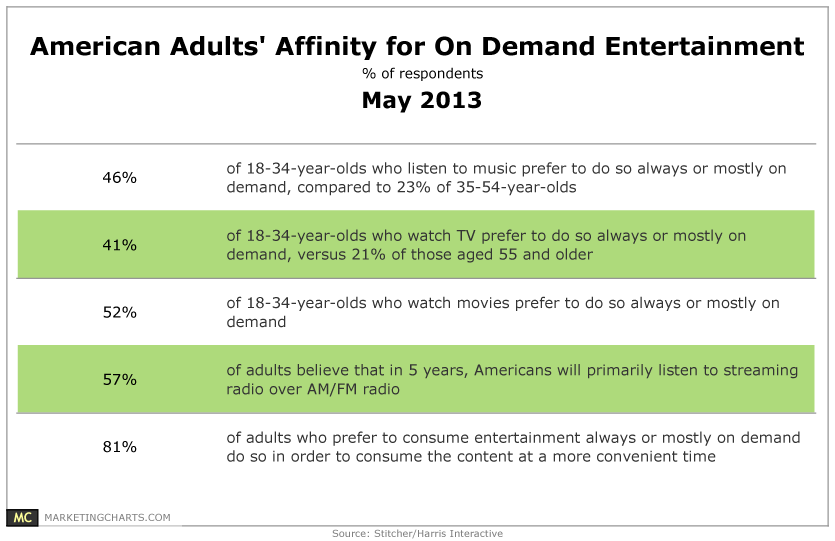
Americans aged 18-34 are more likely than their older counterparts to prefer a range of entertainment types on-demand.
Read MoreHow People Watch TV, May 2013 [CHART]

An average of just 44% of viewing of full-length TV shows is live.
Read MoreAmericans' TV & Video Media Consumption By Generation, Q2 2012 [TABLE]
In Q2 2012, the average US mobile subscriber spent 5 hours and 20 minutes per month watching video on a mobile phone.
Read MoreNorth Americans' Spending Intentions, May 2013 [CHART]
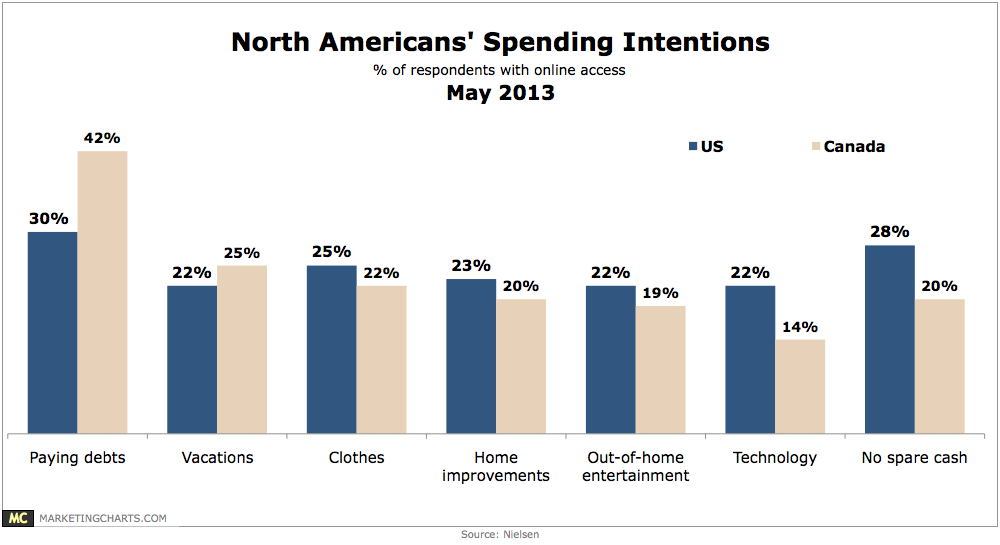
North Americans plan to spend on discretionary items this year, up from 36% the previous quarter.
Read More