Posts Tagged ‘Entertainment Marketing’
Why People Watch A Particular Television Show, June 2013 [CHART]
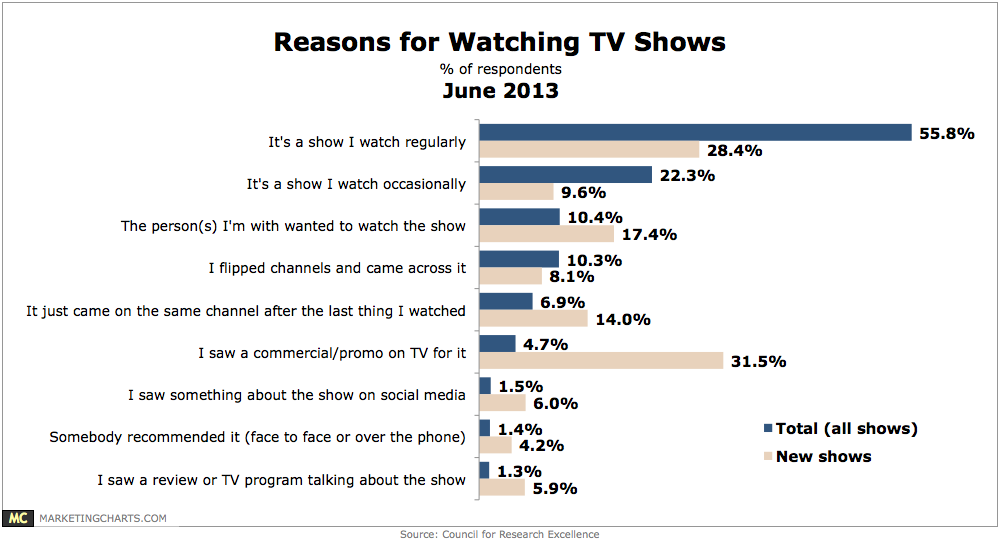
The proportion of study respondents who interact with TV-related content on social media on at least a weekly basis is triple those who do so on a daily basis (37% vs. 12%).
Read MoreFacebook Ad Performance By Industry, Q1 2013 [CHART]
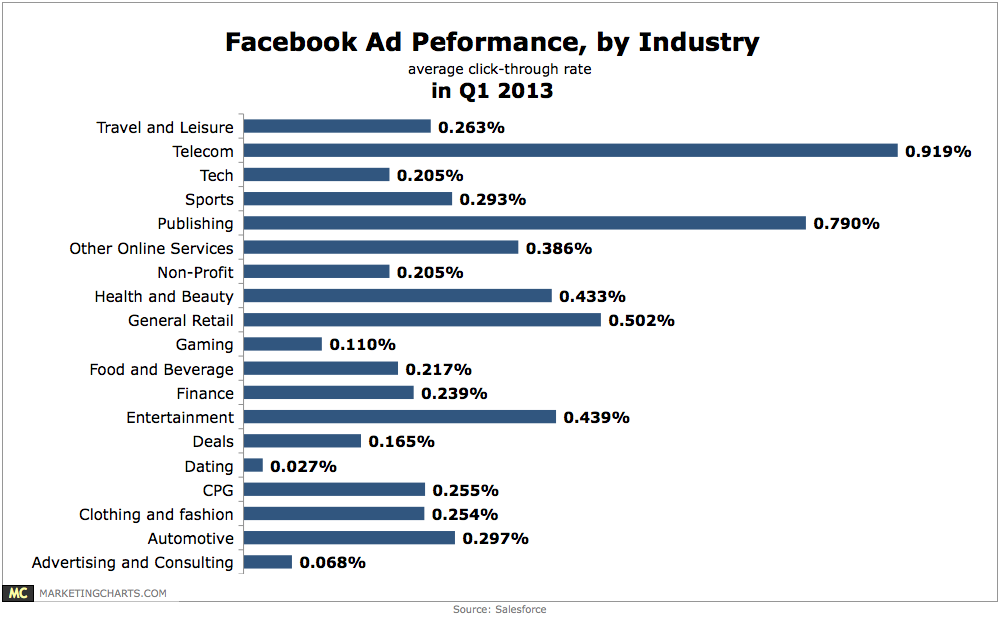
Telecom (0.919%) and publishing (0.79%) brands are leading the charge in click-through rates.
Read MoreCase Study: Miss Utah's Online Reputation Issues [VIDEO]

An examination of the online fallout over Marissa Powell’s (Miss Utah) flubbed answer to a question on income inequality and comparison it to Caitlin Upton.
Read MoreUS Traditional Media Revenue Outlook, 2013-2017 [CHART]
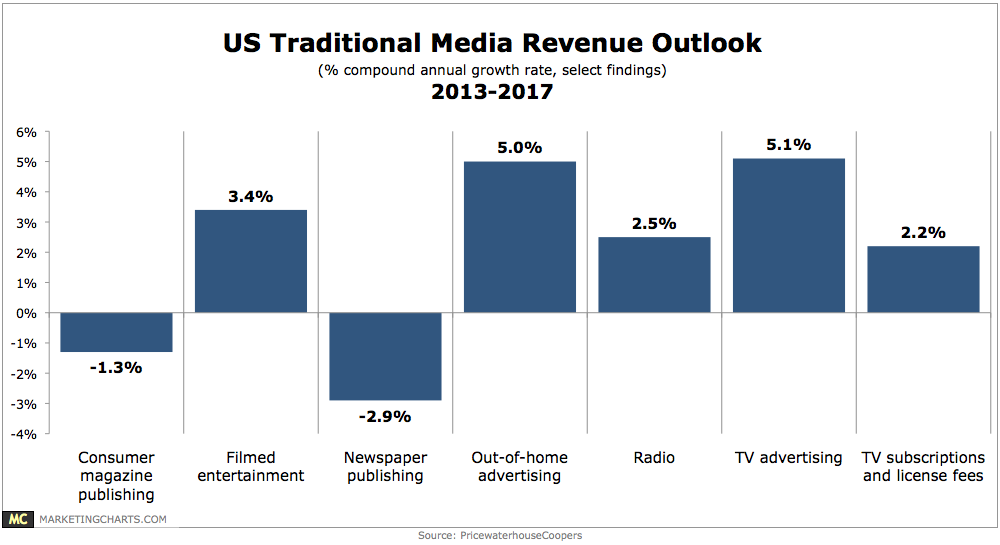
PwC has issued its annual “Entertainment & Media Outlook” report, which contains projections for online and offline media markets through 2017.
Read MoreEmail Volume Variance By Industry, Q1 2013 [CHART]
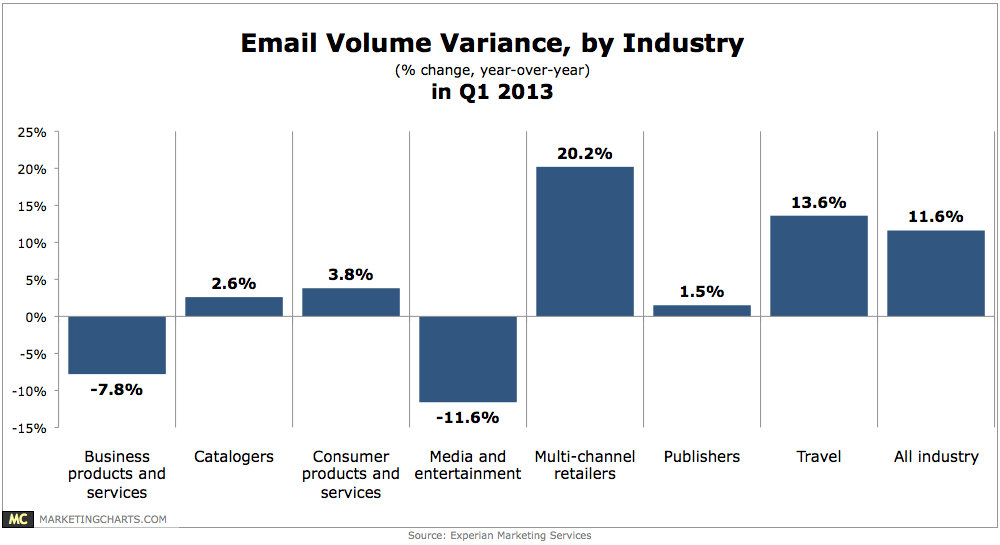
Email volume increased by 11.6% year-over-year in Q1, following a 5.4% year-over-year increase in Q4.
Read MoreProducts Researched & Purchased On A Tablet, March 2012 [TABLE]
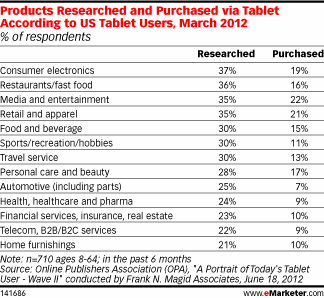
A survey from the Online Publishers Association compared product research with product purchase by category among tablet users in March 2013.
Read MoreTelevision Viewing Places By Device, June 2013 [TABLE]
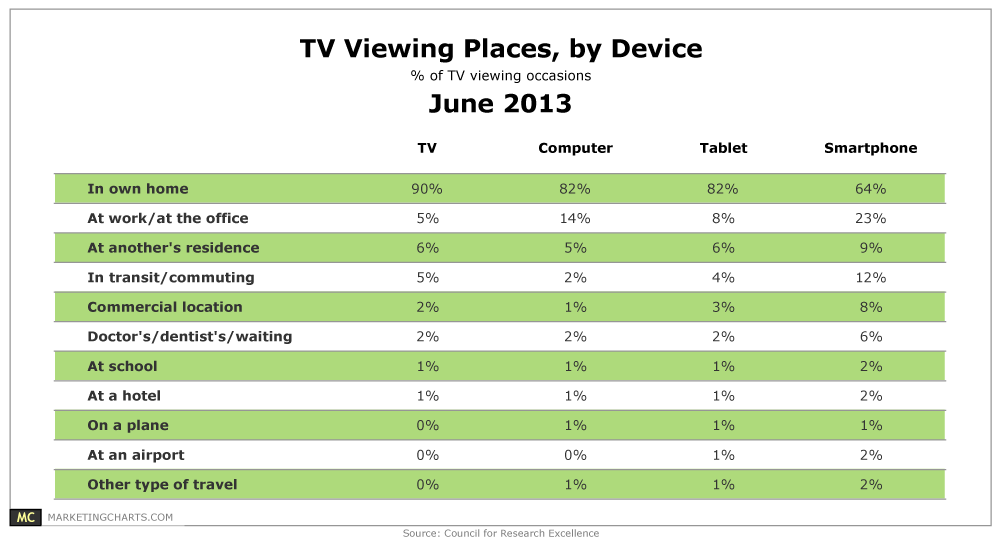
64% of smart phone TV viewing occasions occurred at home.
Read MorePreferred Television Genres By Viewing Device, June 2013 [CHART]
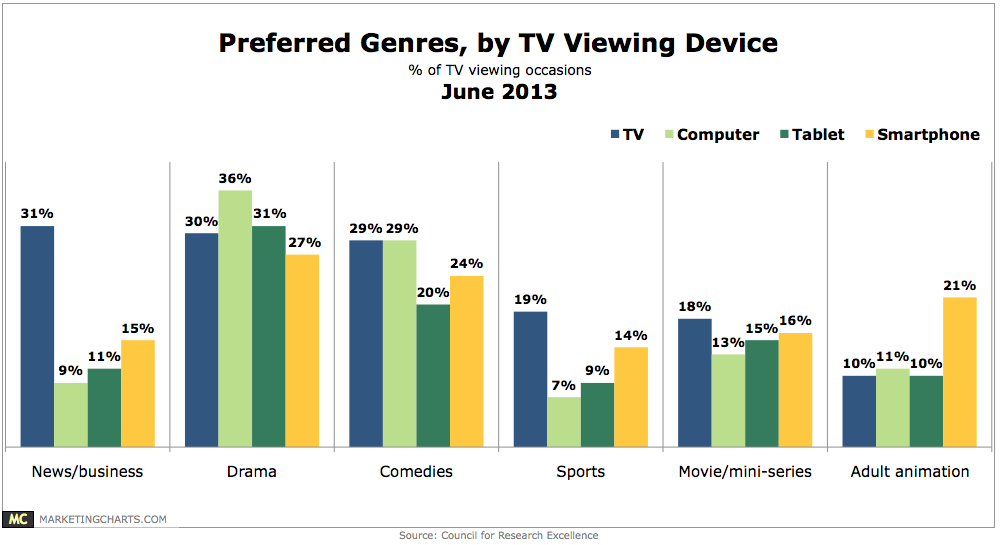
On the traditional TV, news and business (31%) got the edge on drama (30%) and comedies (29%) as the top genres by percentage of viewing occasions.
Read MoreTV Viewing Times By Device, June 2013 [TABLE]
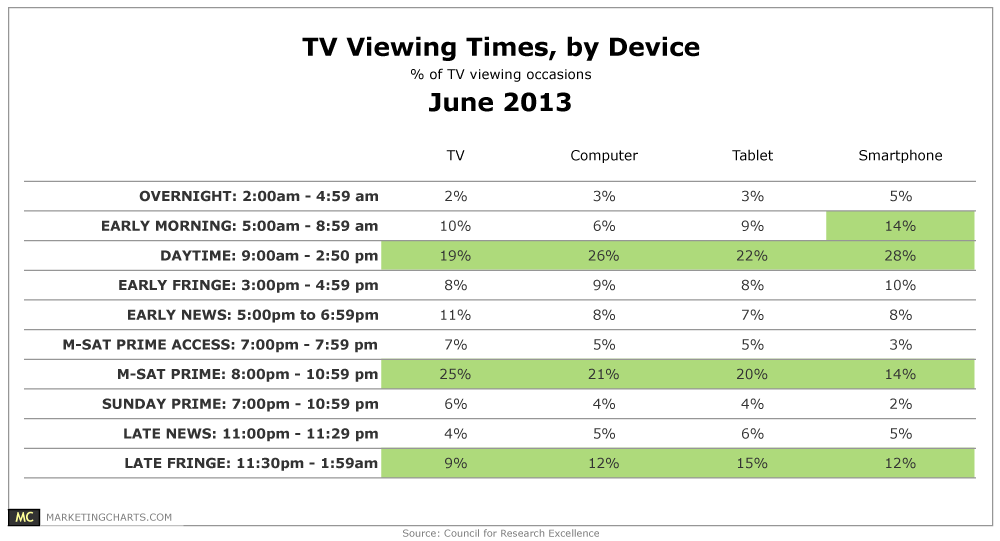
A plurality of tablet (22%) and smart phone (28%) TV viewing occasions tracked occurred during the daytime, between 9 AM and 3 PM.
Read MoreGlobal Entertainment & Media Content Spending, 2008, 2013 & 2017 [CHART]
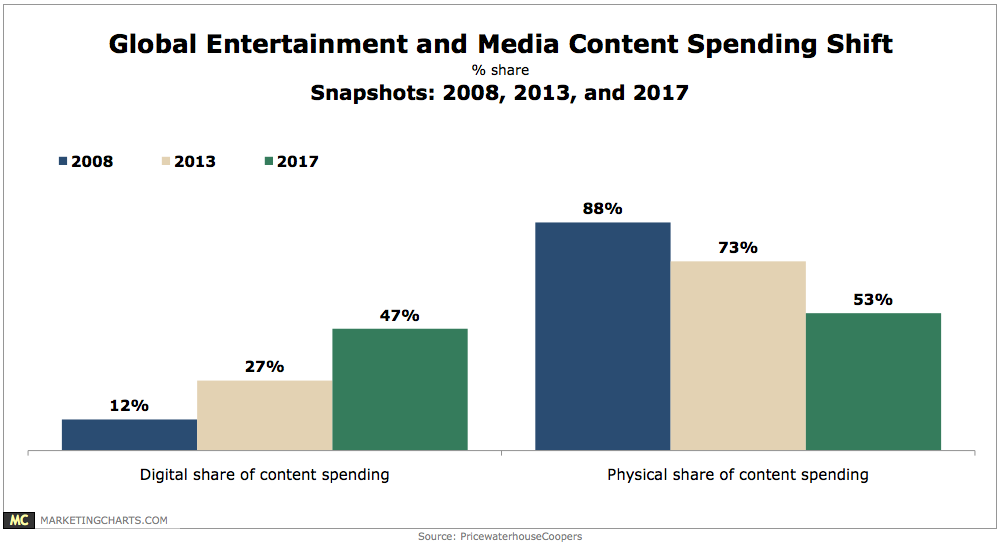
While physical purchases represented 88% of total spending on Entertainment & Media content in 2008, that number has dropped to 73% this year, and will fall to 53% by 2017.
Read More