Posts Tagged ‘Entertainment Marketing’
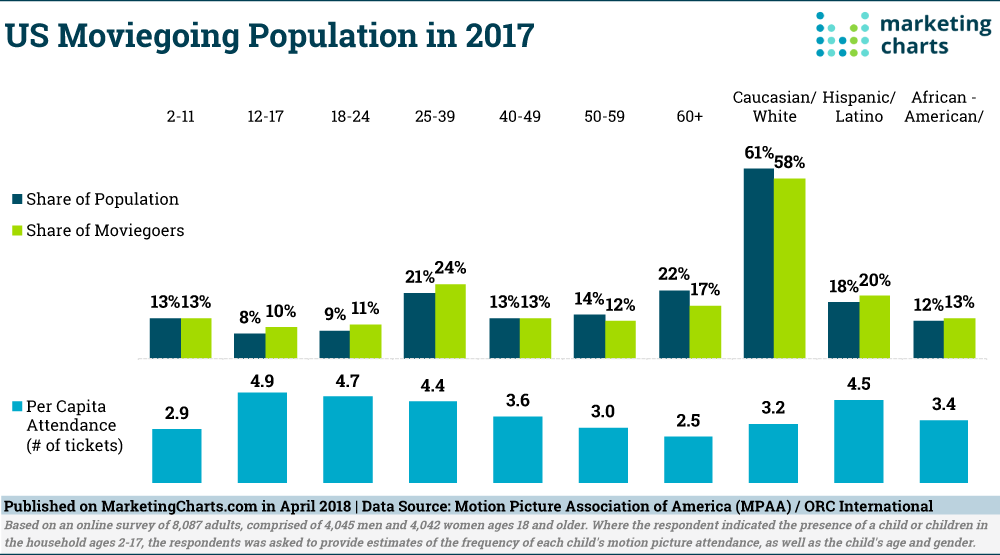
Demographics Of Moviegoers [CHART]
Three-quarters of the US population went to a movie at the cinema at least once last year and roughly 1 in 8 (12%) could be deemed frequent moviegoers in claiming to attend at least once a month.
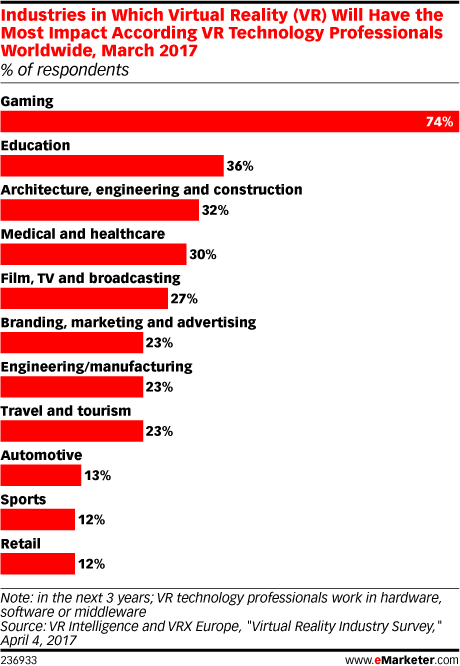
Read MoreIndustries Where VR Will Have The Most Impact [CHART]
Despite the hype, it’s not yet clear if or when virtual reality (VR) technology will reach mass-market status. However, specialized applications are showing promise in a variety of industries.
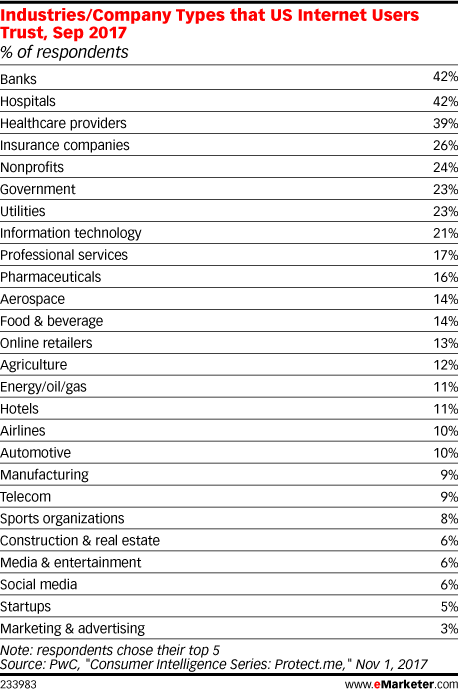
Read MoreConsumer Trust By Industry [TABLE]
Consumers are more likely to trust banks—and even insurance firms—than marketing or advertising companies. That’s according to a September 2017 PwC survey, which found that just 6% of US internet users said they trusted media and entertainment companies.
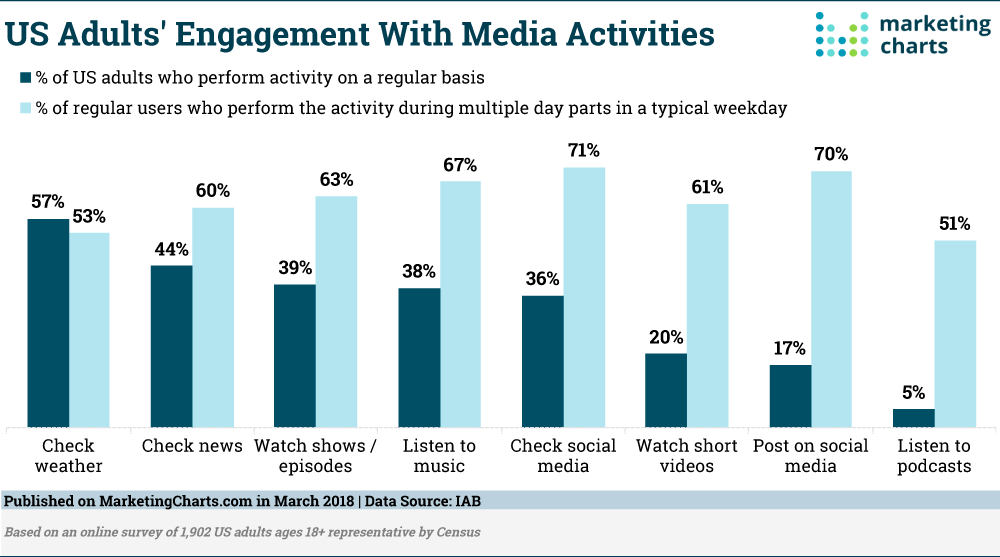
Read MoreMedia Engagement Activities [CHART]
The majority of adults in the US engage with a variety of media on a regular basis, ranging from watching shows and episodes to listening to music, checking social media and watching short videos.
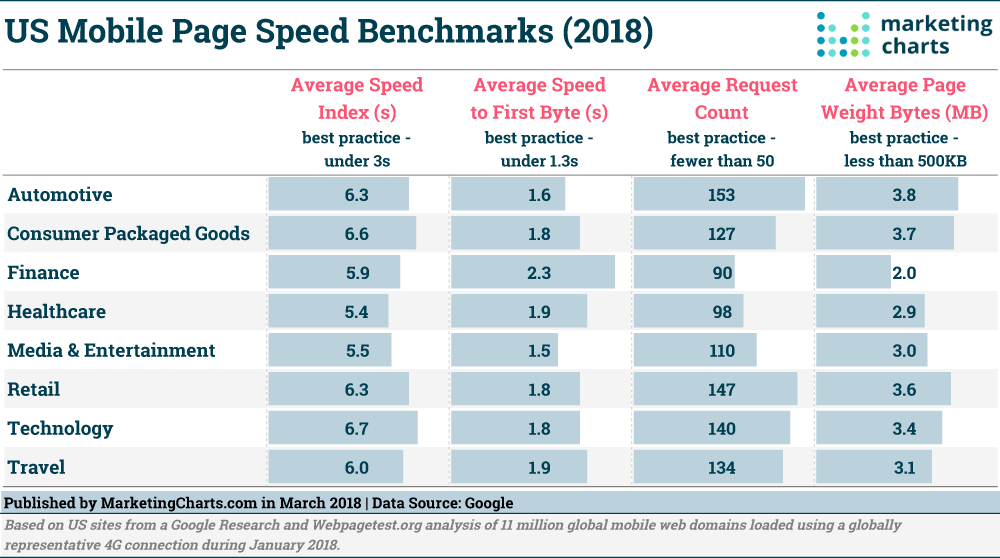
Read MoreMobile Page Speed Benchmarks By Industry [CHART]
The probability of a mobile site visitor bouncing from a page more than doubles when the page load time goes from 1 second to 10 seconds, according to Google’s updated look at mobile page speeds.
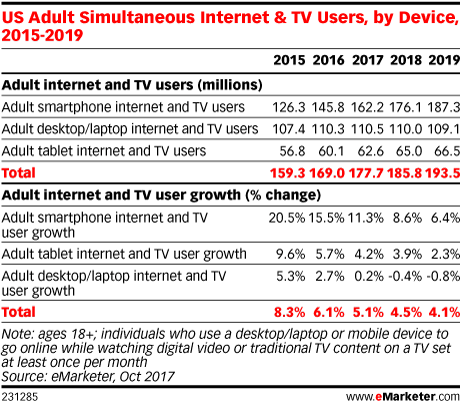
Read MoreMultitainment Users By Device, 2015-2019 [TABLE]
The simultaneous use of second-screen devices—smartphones, tablets and desktops/laptops—while watching TV has increased year to year and will continue through at least 2019.
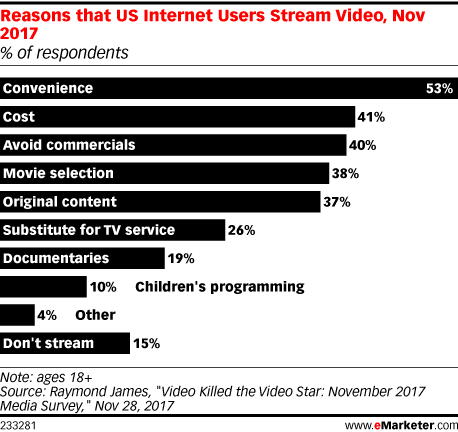
Read MoreWhy People Stream Video [CHART]
The dramatic rise of Netflix and other over-the-top (OTT) video services has fundamentally changed viewing habits in the US, especially among younger users, but in the short run it can be easy to overrate that change.
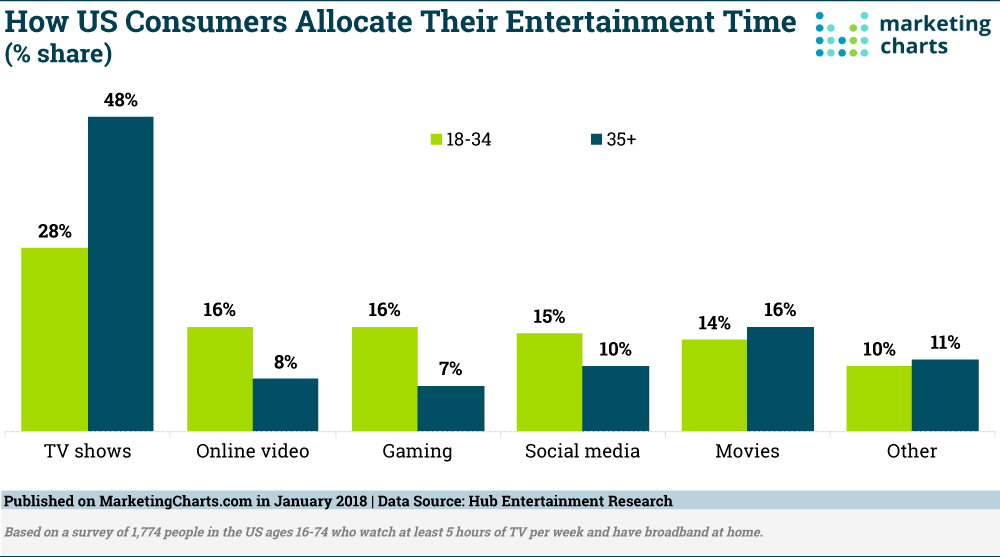
Read MoreEntertainment Media Consumption By Channel [CHART]
The differences between 18-34-year-olds and those 35 and older were predictable, but nonetheless stark. It’s clear that watching TV shows is a far more popular pastime for adults 35 and up than for their younger counterparts.
Read More360 Videos [INFOGRAPHIC]
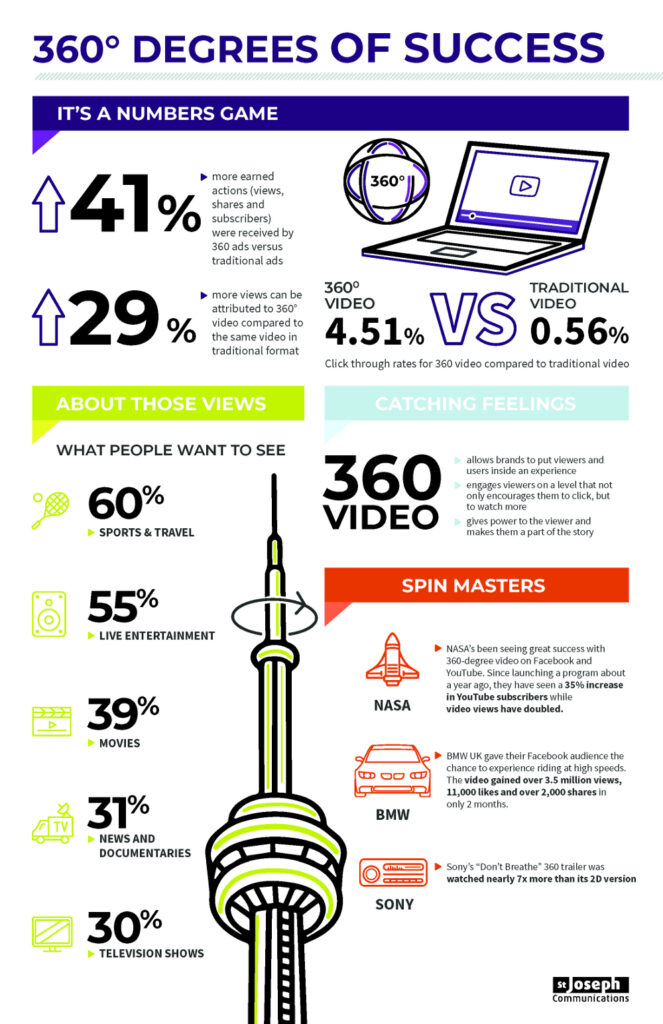
This infographic examines engagement with 360 videos, claiming that they enjoy clickthrough rates averaging 4.51%, compared to 0.56% for traditional videos.
Read MoreUsers Of Streaming Video Services By Provider, 2015-2020 [CHART]
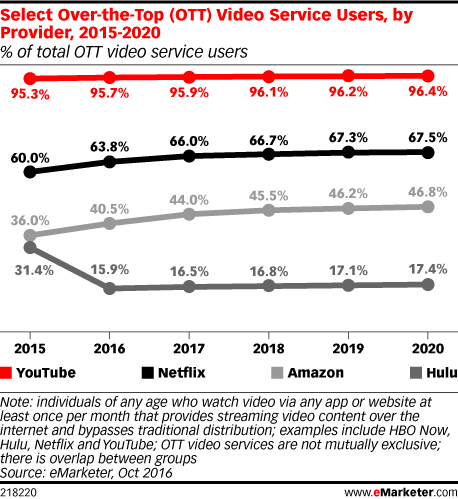
Despite an increasingly competitive digital video space that is packed with new (and successful) properties, usage of YouTube remains strong and the unit continues to be an important part of parent company Alphabet’s portfolio.
Read More