Posts Tagged ‘Entertainment Marketing’
US Online Ad Spending Share By Industry, 2013 [CHART]
Between 2012 and 2017, investment in online and mobile paid media will increase from $36.80 billion to $62.83 billion, for a compound annual growth rate of 11.3%.
Read MoreGlobal Mobile Ad Spending Growth By Industry, Q3 2013 [CHART]
The pharmaceutical industry has done the most to increase mobile ad spending as of Q3 2013.
Read MoreUS Gaming Market Size By Screen, December 2013 [CHART]

170 million Americans play videogames, and 60% of those gamers spend money doing so, resulting in an estimated $20.5 billion in spending by the end of this year.
Read MoreStreaming Video Services Used In North America, Q3 2013 [CHART]
Most respondents did not have any special subscription service to watch digital video content, but among those that did, Netflix was most popular.
Read MoreBooks Vs. Movies [INFOGRAPHIC]
This infographic from LoveReading.co.uk illustrates which is more popular according to online reviews, the book or the movie upon which it is based.
Read MoreTop 10 Grossing Of Movies 2013 [INFOGRAPHIC]
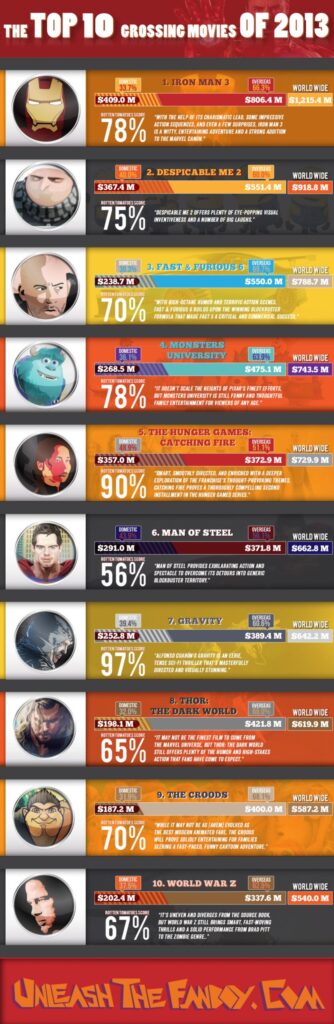
This infographic by Unleash The Fanboy illustrates the top 10 grossing films of 2013.
Read MoreBranded Mobile Video Content Completion Rates, Q1 – Q3 2013 [CHART]
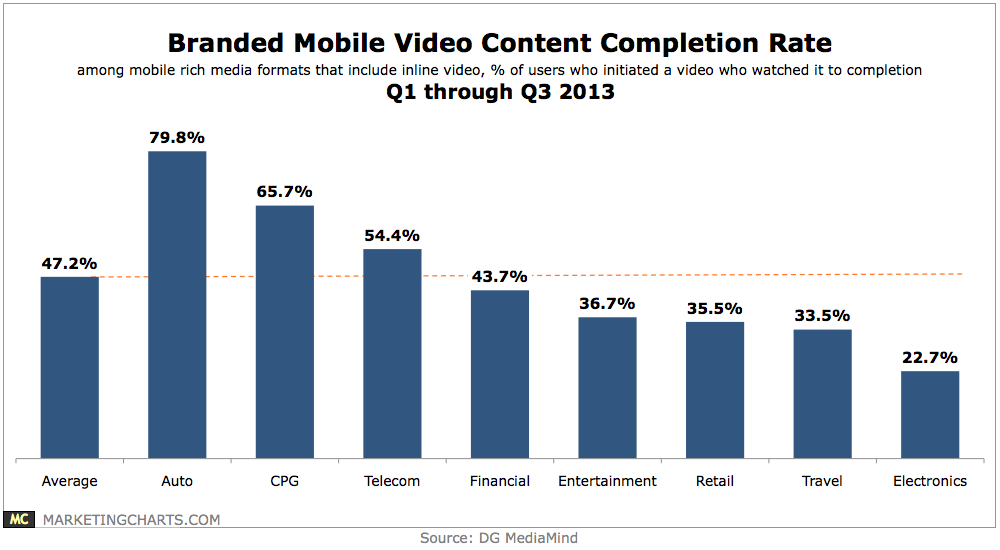
47.2% of branded videos initiated by users were watched to completion, with that figure highest for auto (79.8%), CPG (65.7%) and telecom (54.4%) advertisers.
Read MoreTop TV Programs Of 2013 [TABLE]

As in 2011 and 2012, this year’s top TV programs were almost exclusively the realm of NFL telecasts.
Read MoreTop 10 Smart Phone Apps Of 2013 [CHART]
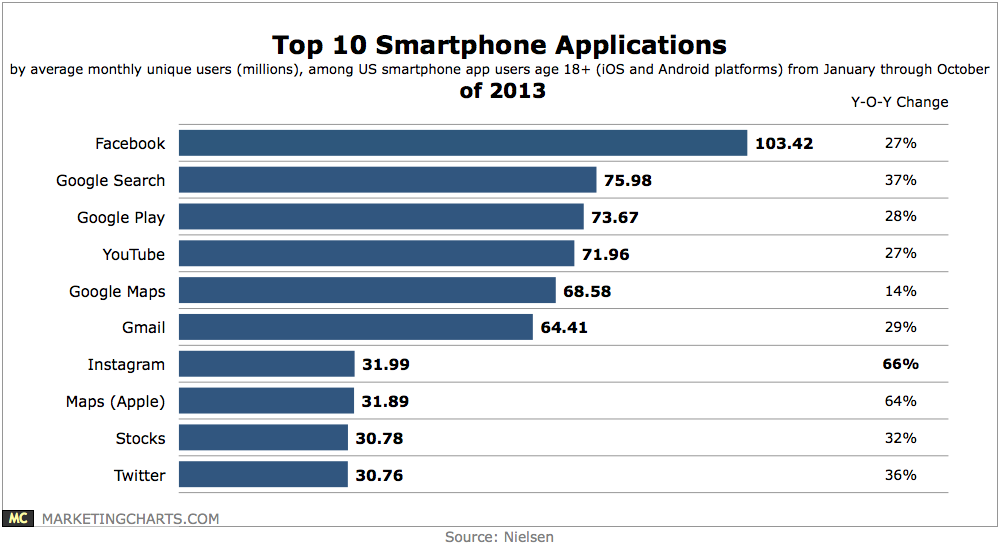
Facebook and Google are dominant among smart phone apps, accounting for 7 of the top 10.
Read MoreTV Streamers' Viewing Preferences, December 2013 [TABLE]
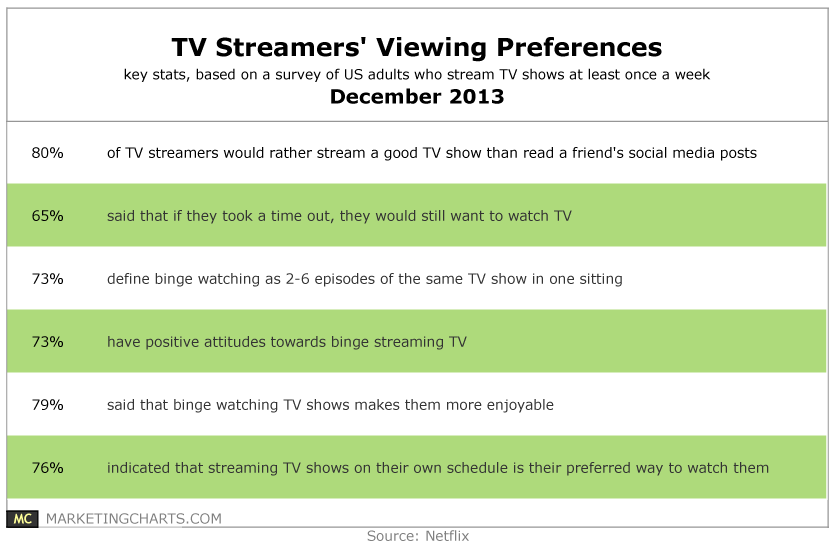
Two-thirds of TV streamers said that if they took a digital time out, they’d still want to watch TV.
Read More