Posts Tagged ‘Entertainment Marketing’
Second-Screeners' Attitudes Toward Synchronized & Asynchronous Content, January 2013 [TABLE]
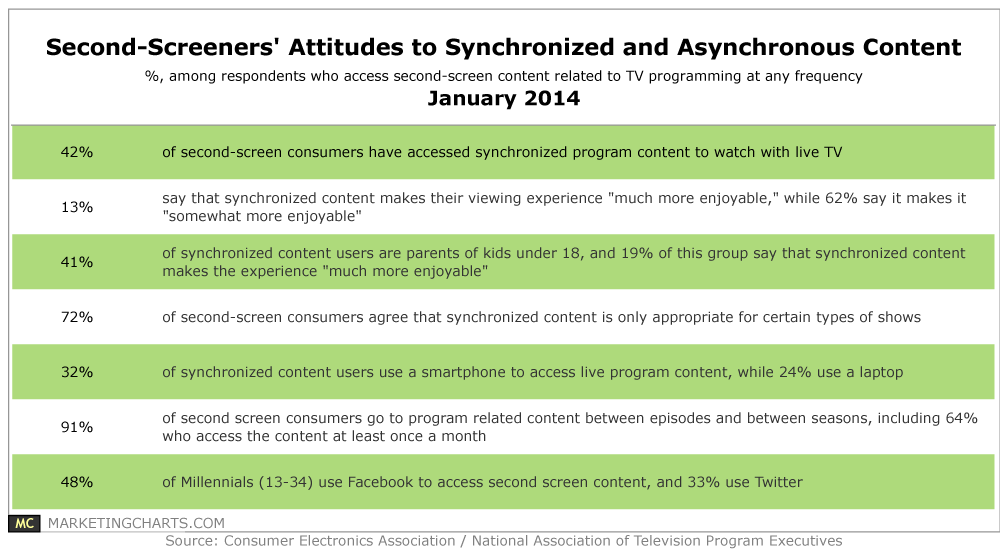
Only 4 in 10 respondents reported trying synchronized program content to watch with live TV, and few found that it significantly enhanced their experience.
Read MoreMobile App Use Growth By Category, 2013 [CHART]
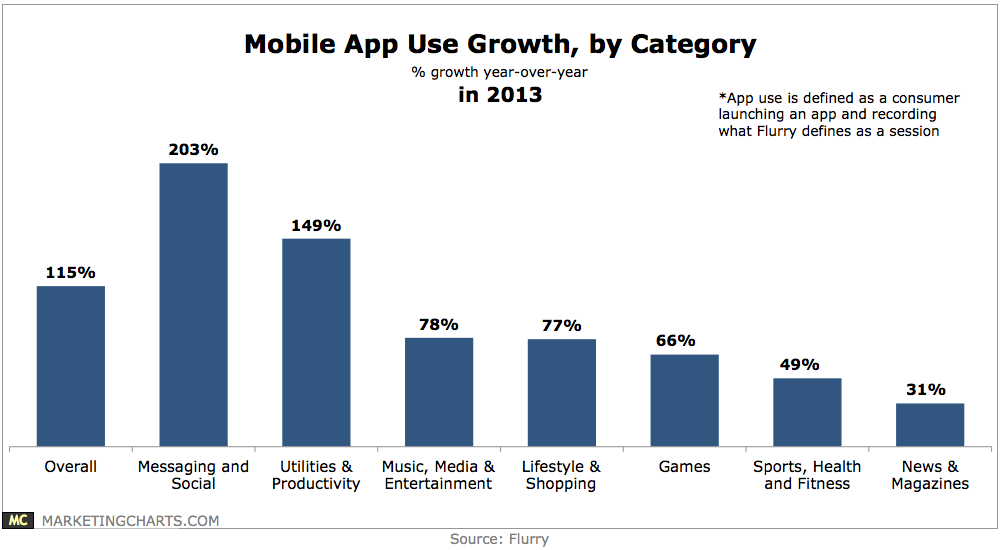
Mobile application use grew by 115% year-over-year in 2013,
Read MoreAmericans' Movie-Going Frequency By Age, January 2014 [TABLE]
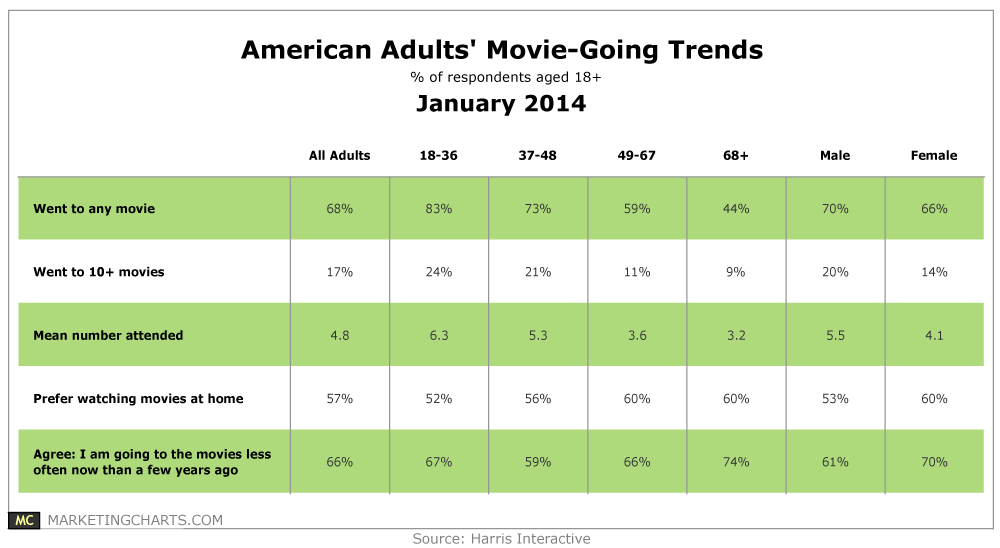
Americans went to about 5 movies on average last year.
Read MoreNorth American Sponsorship Spending, 2012-2014 [TABLE]
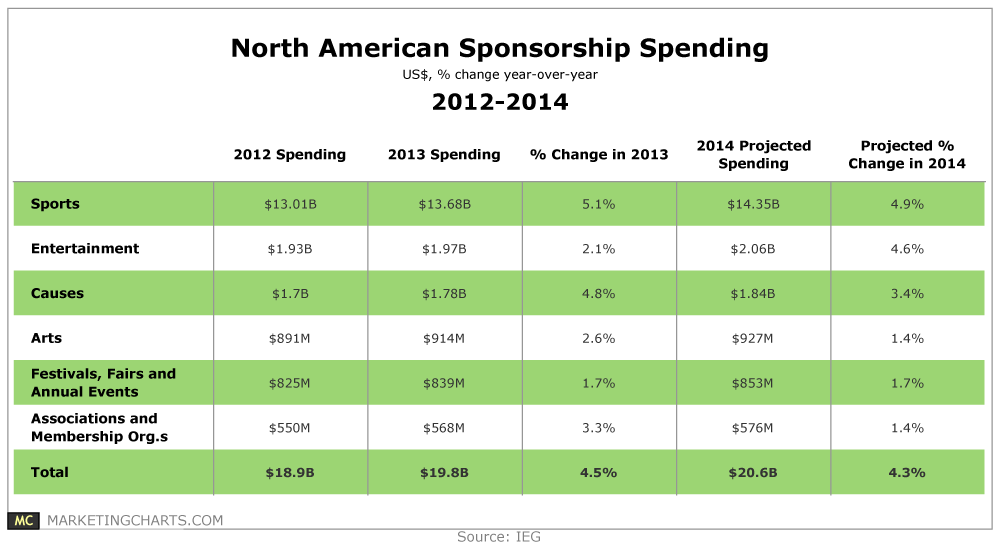
North American sponsorship spending will increase by 4.3% over last year’s $19.8 billion to reach $20.6 billion in 2014.
Read MoreInterest In Mobile Apps, January 2014 [CHART]
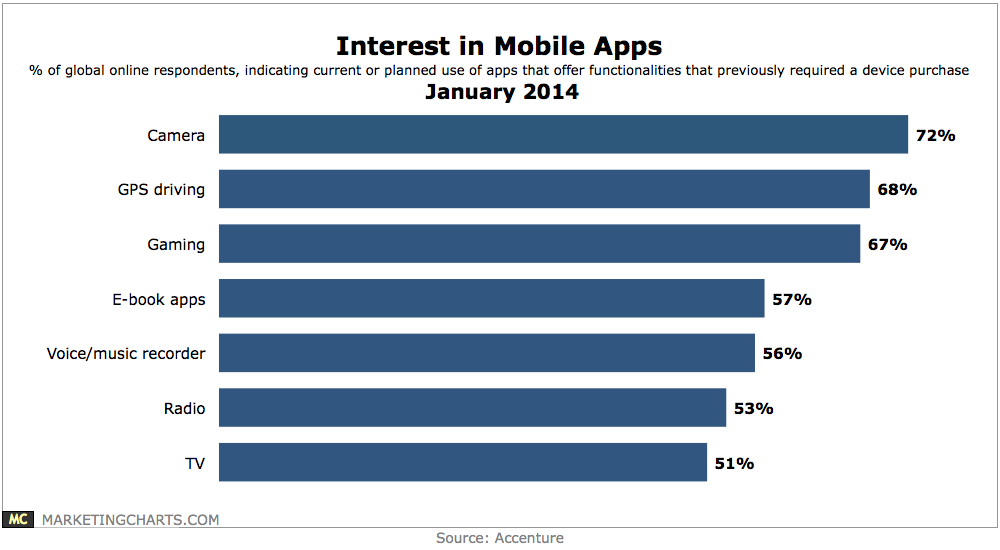
A sizable proportion of consumers from 6 major markets around the world are planning to buy smartphones (52%) and tablets (40%) over the next year.
Read MoreTechnographic Generational Gap By Device, January 2014 [TABLE]
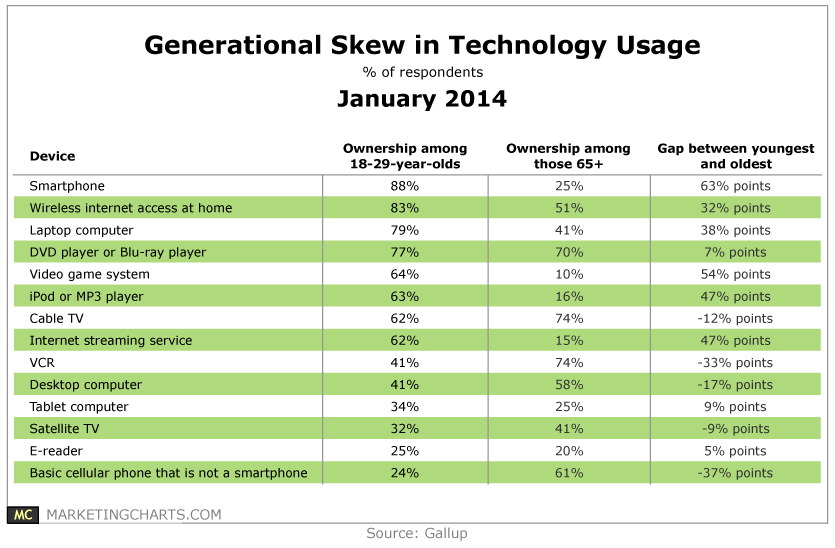
Gallup measured the penetration rates of 14 consumer electronic devices among 18-29-year-olds and those aged 65 and up.
Read MoreGlobal Over-the-Top Online Enabled Device Shipments, 2013 & 2017 [CHART]
Shipments of over-the-top (OTT) devices reached an estimated 1.67 billion worldwide in 2013.
Read MoreGlobal Mobile Banner Ad Interaction Rates, 2013 [TABLE]
Mobile expandable banners had greater success in engaging customers than polite banners across almost all verticals.
Read MoreGlobal Mobile Ad Click-Through Rates By Vertical, 2013 [CHART]
Mobile ads in the retail and electronics categories had the highest clickthrough rates (CTRs), at 0.52% and 0.41%, respectively.
Read MoreUS Online Ad Spending Share By Industry & Objective, 2013 [TABLE]
Spending by some verticals—including travel and retail—skewed much more heavily toward direct-response advertising.
Read More