Posts Tagged ‘Daily Deals’
Time Spent With Shopping Apps By Category, December 2011 – December 2012 [CHART]
Retailer apps saw a massive 525% jump in time spent from December 2011 to December 2012, roughly double the growth rate in time spent with the average shopping app (274%).
Read MorePurchase Influence Of Marketing Messages By Select Channels, January 2013 [CHART]
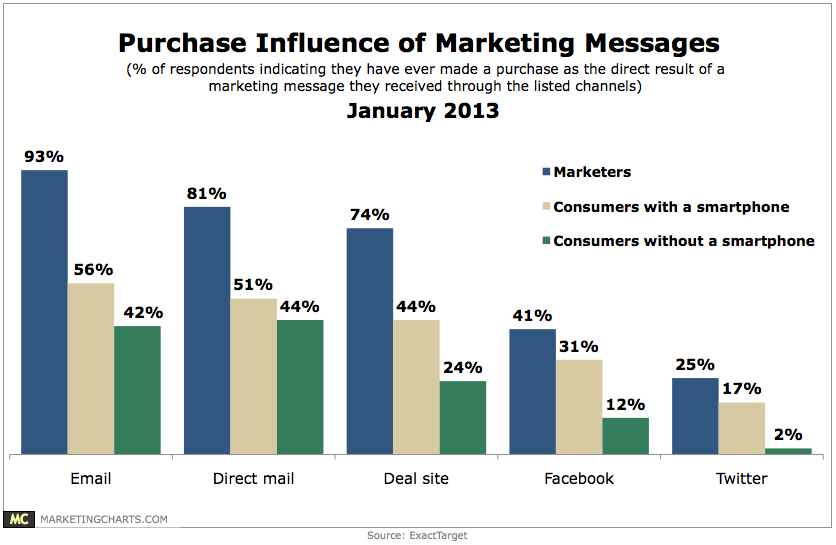
93% of marketers surveyed have made a purchase as a direct result of an email marketing message, compared to 56% of smart phone-owning consumers and 42% of consumers without a smart phone.
Read MoreHow Arts Organizations Use Their Website [CHART]
The most common activities relate to posting and sharing content: 94% of these arts organizations use their website to post photos, 81% are posting or streaming video.
Read MoreMobile Device Users Attitudes Toward Ads By Medium, November 2012 [CHART]

Smart phone and tablet owners may love their devices, but they’re not all that fond of advertising on them.
Read MoreHoliday Online Deal Seeking By Income, November 2012 [CHART]

Among those intending to purchase holiday gifts, 51.3% of those under $15,000 think that at least one-quarter of their purchases will be discounted.
Read MoreEmail Inbox Clutter [CHART]
43% said that more than half of the new emails in their inbox the week prior to the survey came from marketers.
Read MoreAmerican Consumer Spending On Online Deals, 2011-2016 [CHART]

US consumer spending on online deals (e.g. daily deals, instant deals and flash sales) will reach $3.6 billion this year, up from last year’s $1.8 billion.
Read MoreSMBs' Social Media Channels, March 2012 [CHART]

When it comes to the specific social channels SMBs are using, Facebook, not surprisingly, tops the list, with 26% of small businesses and 38% of medium-sized businesses saying they used a company Facebook page.
Read More