Posts Tagged ‘CPG Marketing’
US Online Ad Spending Share By Industry & Objective, 2014 [TABLE]
US advertisers will collectively spend upward of $50 billion on digital advertising in 2014.
Read MoreGlobal Mobile RTB Ad Spending By Industry, Q1 2014 [CHART]
eMarketer expects increases in US real-time bidding (RTB) digital display ad spending.
Read MoreCPG Brand Decision Influencers, Q1 2014 [CHART]
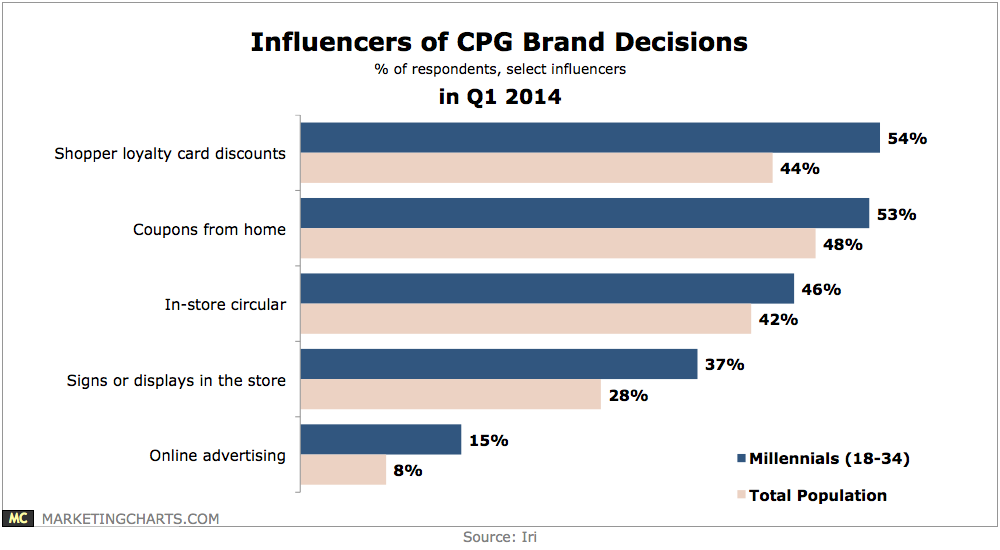
Millennial (18-34) shoppers are much more likely than the average adult to use smartphones to find CPG coupons (41% vs. 13%).
Read MoreUS Industry Reputation Ratings, April 2014 [CHART]
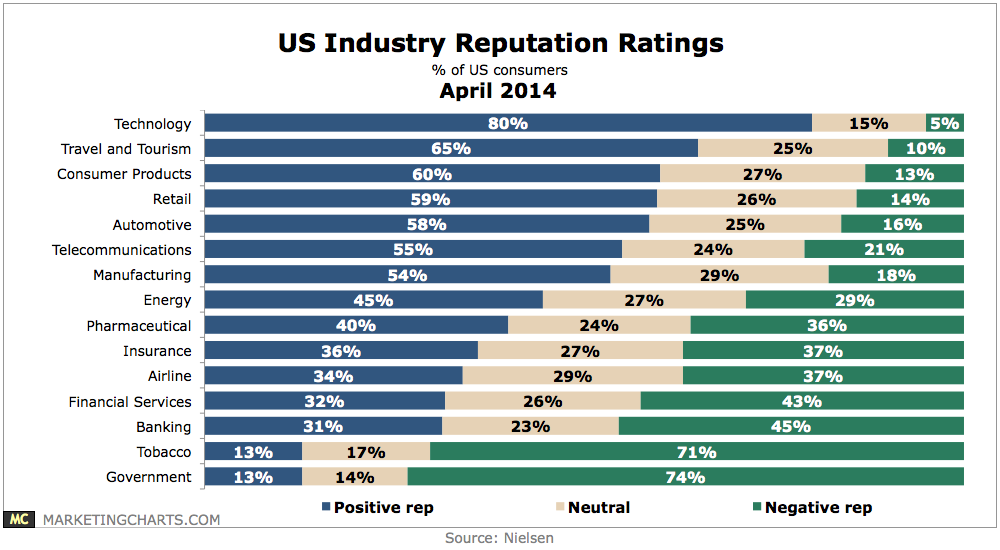
1 in 5 American adults believe that the reputation of corporate America has improved over the past year.
Read MoreUse Of Mobile Tools For CPG Shopping, 2012 & 2013 [TABLE]
Mobile shopping apps were the most helpful, used by 27% and cited by 40% as useful for CPG shopping.
Read MoreHelpful Mobile Shopping Tools For CPG Product Shoppers, 2012 & 2013 [CHART]
The number of consumers using augmented reality will likely grow as marketers respond to the positive feedback from those who are using it.
Read MoreUS Online Video Advertising Share By Industry, Q4 2013 [CHART]
Video advertising platform Videology reported that its consumer goods clients in the US were ahead of other verticals in Q4 2013 in serving digital video ads.
Read MoreAmericans' Small-Ticket Purchase Cutbacks, April 2014 [CHART]
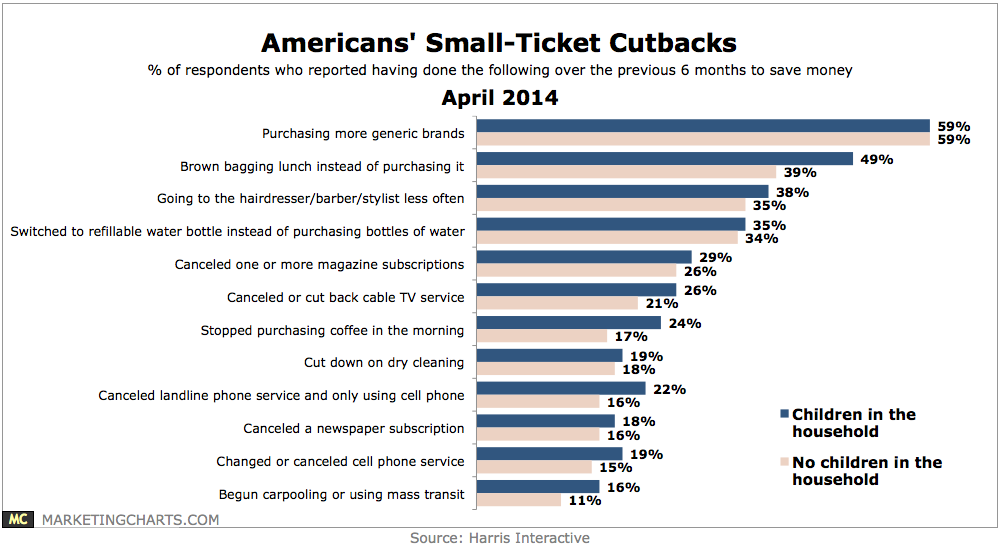
Parents are also more likely than those without children in the household to decrease their spending in a variety of areas, including restaurants (64% vs. 56%) and entertainment (60% vs. 51%).
Read MoreOnline Ad Campaign In-Target Rates By Vertical, Q1 2014 [CHART]
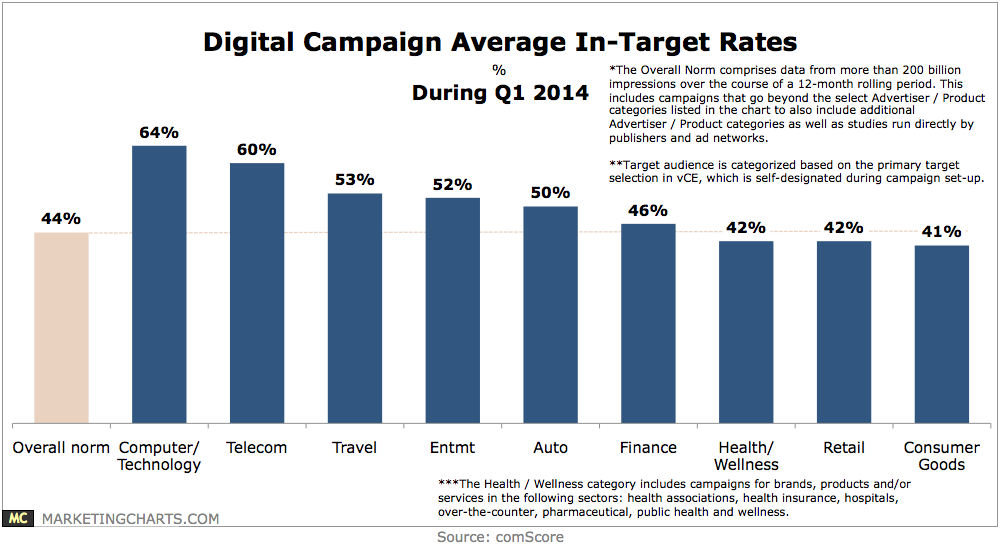
In-target rates range from a high of 61% for computer/technology advertisers to a low of 41% for consumer goods campaigns.
Read MoreMobile Rich Media & Video Ad CTR vs Standard Banners, 2013 [CHART]
Mobile ads that integrated interactive and animated features saw click-through rates (CTRs) multiple times higher than standard banner ads last year across a variety of verticals.
Read More