Posts Tagged ‘CPG Marketing’
Average Website Conversion Rates By Industry [CHART]
Average conversion rates broken down by industry.
Read MoreHow People Prefer To Get Information, December 2012 [CHART]
Across 18 different categories, postal mail is preferred in 15.
Read MoreUS Search Advertising Click-Through Rates By Industry, Q3 2011- Q3 2012 [CHART]
US overall paid search clickthrough rates for travel and leisure dropped considerably year-over-year from Q3 2011, falling 34%, from 7.94% down to 5.28%.
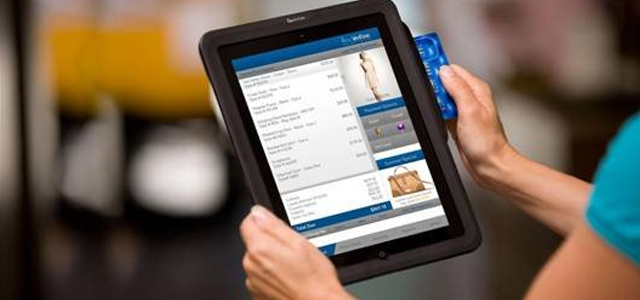
Read MoreOnline vs In-Store Purchase Preferences By Product Type [CHART]
Consumers preferred online for research and locating specific items. They preferred stores for returns and ‘knowing exactly what was being purchased.’
Read MoreMost Valuable Big Data Sets For Consumer Goods/Retail Industry, February 2012 [CHART]

Senior executives ascribed much greater value to point-of-sale and social media data for retail and CPG companies compared to other industries.
Read MoreCost-Consciousness Of CPG Shoppers By Generation, October 2012 [CHART]
Fully 37% of Gen X adults surveyed buy brands that are on sale, rather than the brands they prefer.
Read MorePre-Roll Video Ad Metrics By Industry, Q2 2012 [CHART]
In-stream video buying platform VideoHub reported in Q2 that US online pre-roll CPG video ads had a 73.03% completion rate, slightly above the average for all industries.
Read MoreOnline Video Viewership Among Select Industries Worldwide, Q3 2012 [CHART]

Viewership of online videos in the CPG category was up sharply in Q3 2012 compared to the previous quarter.
Read MoreInternet Ad Revenues By Industry, H1 2011 vs H1 2012 [CHART]
Retail advertisers accounted for 20% of the $17 billion in first half (H1) revenues, or $3.4 billion.
Read More