Posts Tagged ‘CPC’
Marketing Acronyms [INFOGRAPHIC]
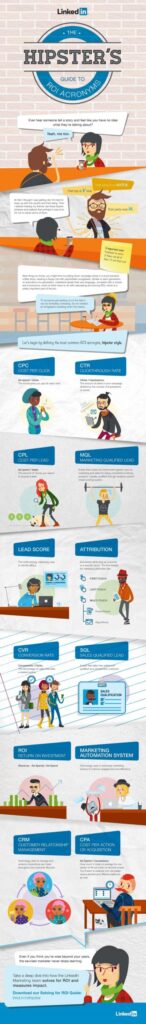
This infographic from LinkedIn explains the definitions of twelve marketing acronyms, some of which you’ve no doubt heard, others of which perhaps you haven’t.
Read MoreGoogle Search Advertising [INFOGRAPHIC]
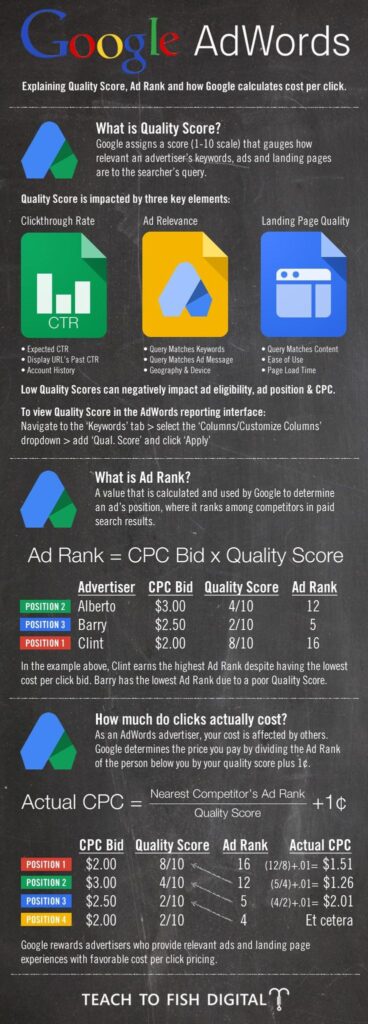
This infographic from Teach To Fish Digital illustrates the Google AdWords Quality Score and the cost per click calculations.
Read MoreFacebook Advertising Benchmarks [INFOGRAPHIC]
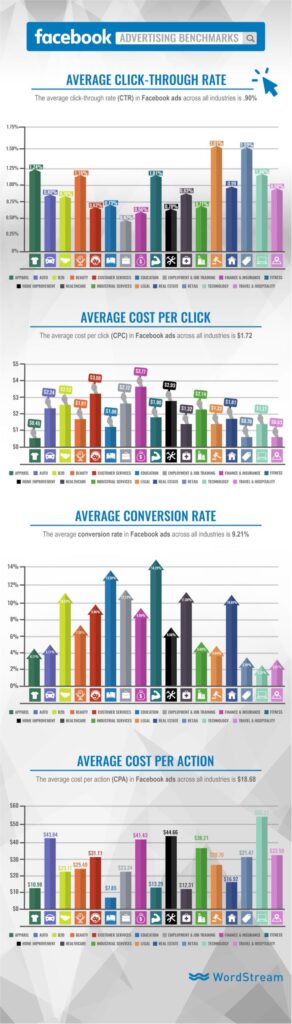
This infographic from WordStream illustrates the most important Facebook advertising benchmarks, including click-through rate, cost-per-click, conversion rate, and cost-per-action across 18 different industries.
Read MoreFacebook Advertising Benchmarks, Q1 2015 [CHART]
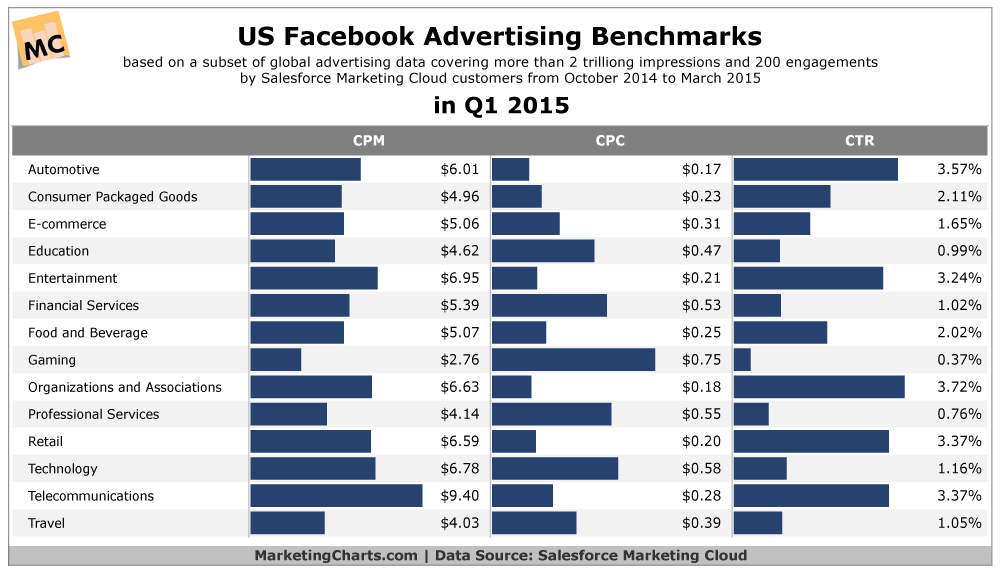
Facebook advertising CPMs were highest for the telecommunications industry and lowest for the gaming vertical in Q1 2015.
Read MoreSearch Advertising Trends, Q3 2014 [TABLE]
Search ad click-through rates in the US saw significant year-over-year increases.
Read MoreUS Paid Search Benchmarks By Device, 2013 [CHART]
Click-through rates across devices much more similar when normalizing for ad position, at least for positions 1 through 5. Marin’s study also predicts that by the end of next year, mobile could account for half of all paid search clicks.
Read MoreCTR & CPC Rates for Product Listing Ads, Q4 2012-Q4 2013 [TABLE]
Google’s Product Listing Ads (PLAs)—enhanced search ads that include features such as price and image—saw steep growth in Q4 2013.
Read MoreGlobal Paid Search Metrics By Region, Q4 2013 [TABLE]
Clicks for paid search increased 12.3% year over year worldwide, although impressions had dropped by just over 10%.
Read MoreTop Metrics Used To Measure Native Advertising, June 2013 [CHART]
The majority of US marketers used engagement to measure native advertising.
Read MoreFacebook Advertising Key Performance Indicators [INFOGRAPHIC]
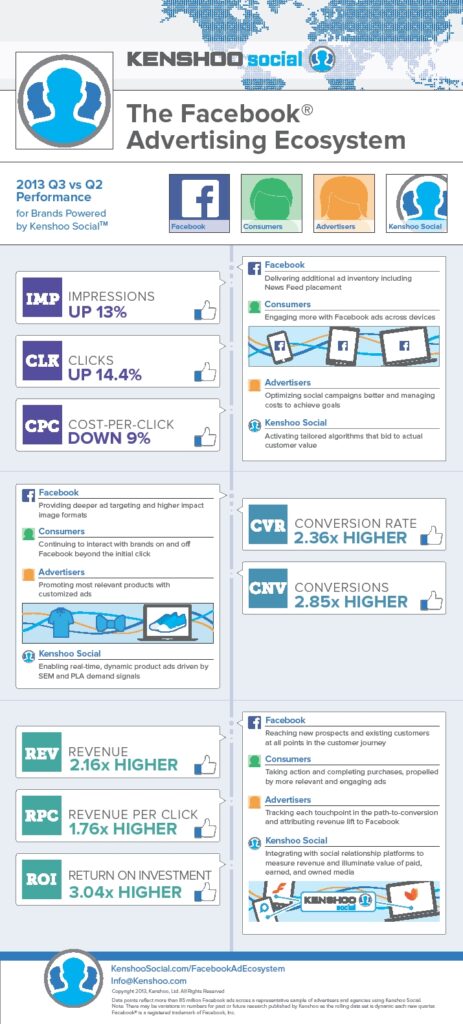
This infographic by Kenshoo Social (via AllFacebook) illustrates the key performance indicators for Facebook advertising for Q2 vs Q3 2013.
Read More