Posts Tagged ‘Cost-Per Click’
Marketing Acronyms [INFOGRAPHIC]
This infographic from LinkedIn explains the definitions of twelve marketing acronyms, some of which you’ve no doubt heard, others of which perhaps you haven’t.
Read MoreGoogle AdWords Benchmark Metrics By Industry [CHART]
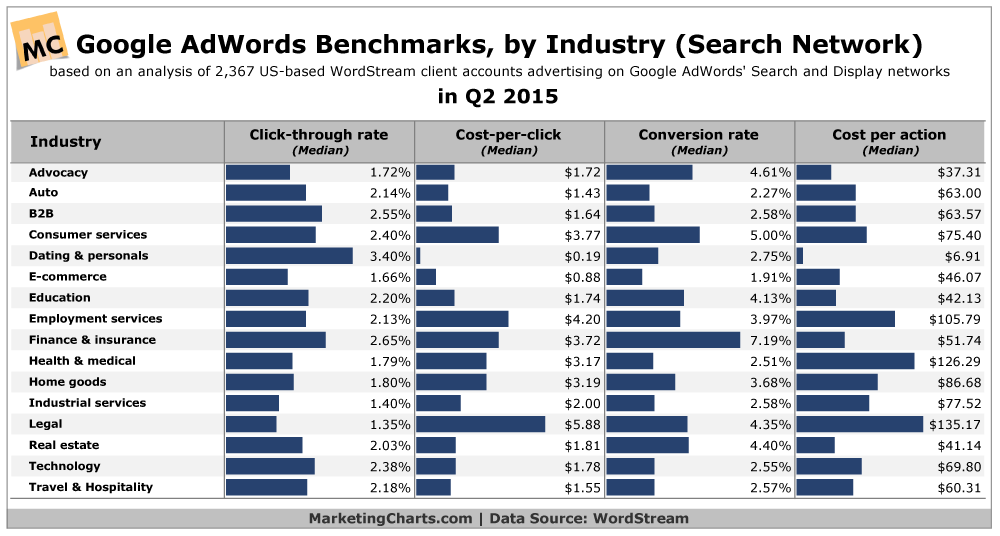
The median click-through rate (CTR) in AdWords across industries is 1.91% on the search network.
Read MoreHow Do Google AdWords Work? [INFOGRAPHIC]
This infographic by Pulp Media explains how Google AdWords advertising works.
Read MoreGoogle AdWords 101 [INFOGRAPHIC]
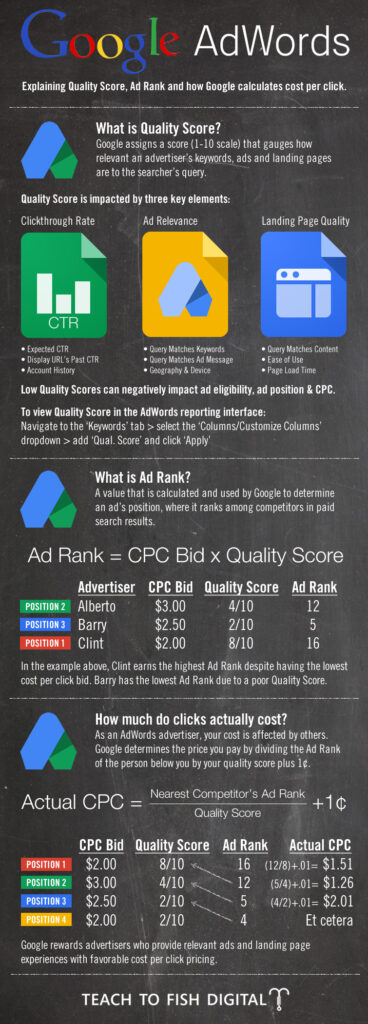
This infographic explains Google’s AdWords Quality Score, Ad Rank and how Google calculates cost-per-click.
Read MoreMobile App Advertising Trends, 2014 [CHART]
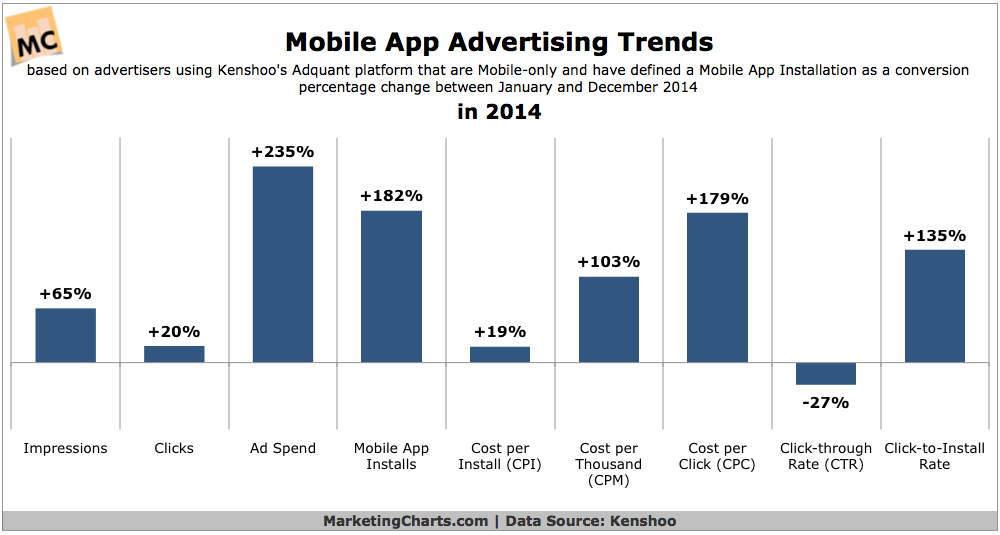
Mobile application installs grew by 182% between January and December 2014, almost keeping pace with the growth in ad spending of 235%.
Read MoreMarketers' Most Popular Online Metrics, August 2014 [CHART]
Clicks, response and conversion rates (51%) the most commonly-cited top-5 measure.
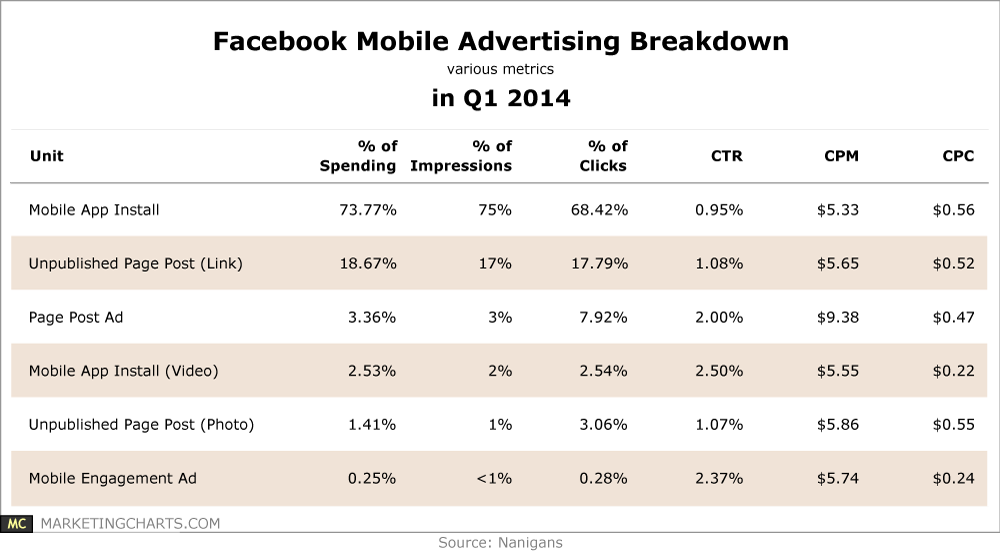
Read MoreFacebook Mobile Advertising Metrics, Q1 2014 [TABLE]
Almost three-quarters of Facebook mobile ad spending was directed at mobile application install ads in Q1.
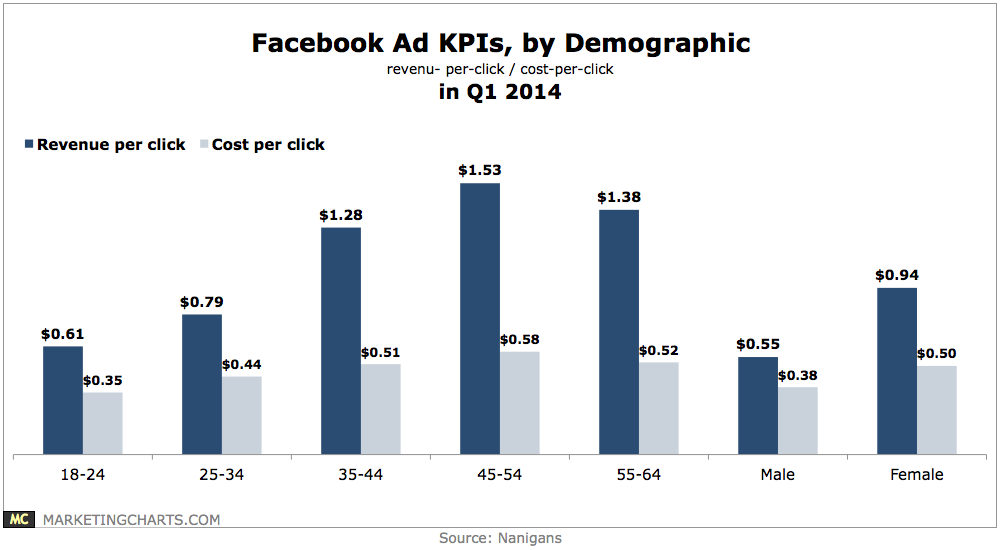
Read MoreFacebook Ad KPIs By Demographic, Q1 2014 [CHART]
Roughly one-quarter of ad spending aimed at Facebook users aged 18-64 was directed to the 18-24 bracket in Q1.
Read MoreHow Google Makes $100 Million A Day [INFOGRAPHIC]
This infographic by WordStream breaks down Google’s daily ad revenue.
Read MoreUS Paid Search Metrics By Device, Q2 2012 [CHART]
Despite having lower cost per click rates than PCs, tablets offered a 68% higher ROI than PCs for US search advertisers in Q2, based on 20% higher conversion rates.
Read More
