Posts Tagged ‘Consumer Electronics Marketing’
Most Common Purchases On Mobile Phones, Tablets & PCs, March 2014 [TABLE]
The vast majority of mobile phone and tablet owners have purchased products and services on their devices.
Read MoreMost Branded Video Ad Views By Top 5 Industries, Q4 2013 [CHART]
Videos focused around electronics products pulled in 365.0 million views.
Read MoreProduct Category Purchased By Millennials After Sharing On Social, Fall 2013 [TABLE]
US millennial internet users flocked to different social networks to post about different types of products they wanted to buy.
Read MoreConsumer Electronics Owned By Americans, January 2014 [TABLE]
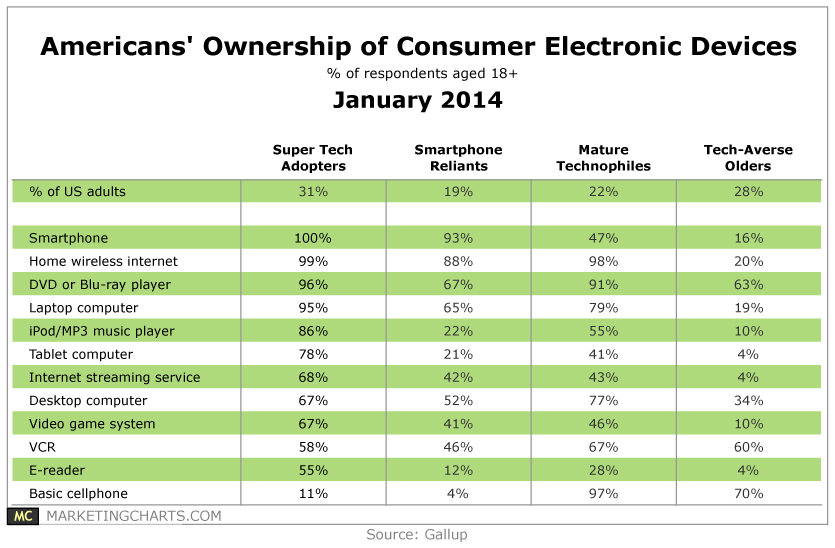
Of the 12 consumer electronics devices identified, 9 see penetration rates of 67% or higher among Super Tech Adopters.
Read MoreGlobal Mobile Banner Ad Interaction Rates, 2013 [TABLE]
Mobile expandable banners had greater success in engaging customers than polite banners across almost all verticals.
Read MoreGlobal Mobile Ad Click-Through Rates By Vertical, 2013 [CHART]
Mobile ads in the retail and electronics categories had the highest clickthrough rates (CTRs), at 0.52% and 0.41%, respectively.
Read MoreTop 5 Industries By Number Of Branded Video Views, Q3 2013 [CHART]
The top industry for such views was electronics, which ranked far ahead of runner-up mobile phones.
Read MoreUS Online Ad Spending Share By Industry, 2013 [CHART]
Between 2012 and 2017, investment in online and mobile paid media will increase from $36.80 billion to $62.83 billion, for a compound annual growth rate of 11.3%.
Read MoreBranded Mobile Video Content Completion Rates, Q1 – Q3 2013 [CHART]
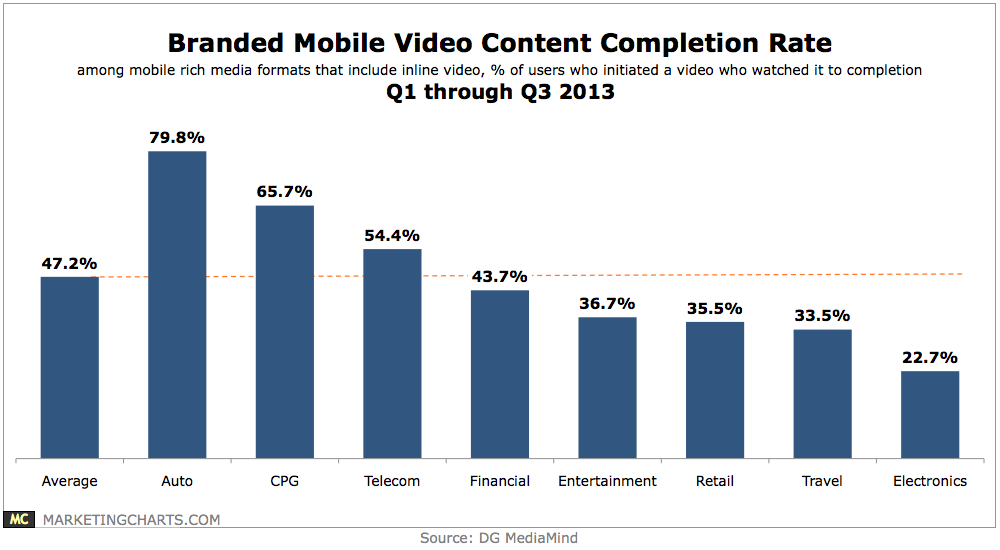
47.2% of branded videos initiated by users were watched to completion, with that figure highest for auto (79.8%), CPG (65.7%) and telecom (54.4%) advertisers.
Read MoreEffect Of Email Subject Line Personalization On Open Rates By Industry, November 2013 [CHART]
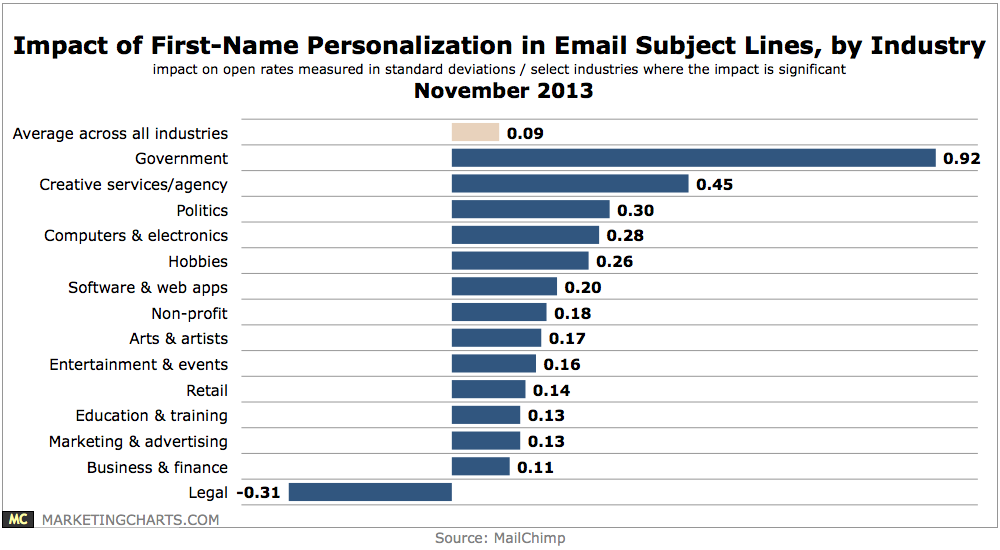
New data from MailChimp supports the case that personalization can drive higher email open rates.
Read More