Posts Tagged ‘Consumer Electronics Marketing’
Social Amplification Rate Of US Influencers By Industry, H1 2015 [CHART]
Social amplification rates of US influencers were highest in the electronics category, at 0.66%.
Read MoreSocial Engagement Rate For US Influencers By Industry, H1 2015 [CHART]
The Social engagement rate for US influencers averaged 3.4% in H1 2015.
Read MoreEarned Media Value Of Influencer Marketing By Industry, H1 2015 [CHART]
The average earned media value from US influencer marketing programs was 1.4 times higher in H1 2015 than the overall average in full-year 2014.
Read MoreFrequency Of On-Screen TV App Use, November 2014 [CHART]
The installed base of US connected TVs was at 22 million in Q4 2014, up from 13 million in Q4 2013.
Read MoreFastest-Growing Retail eCommerce Categories, 2014 [CHART]
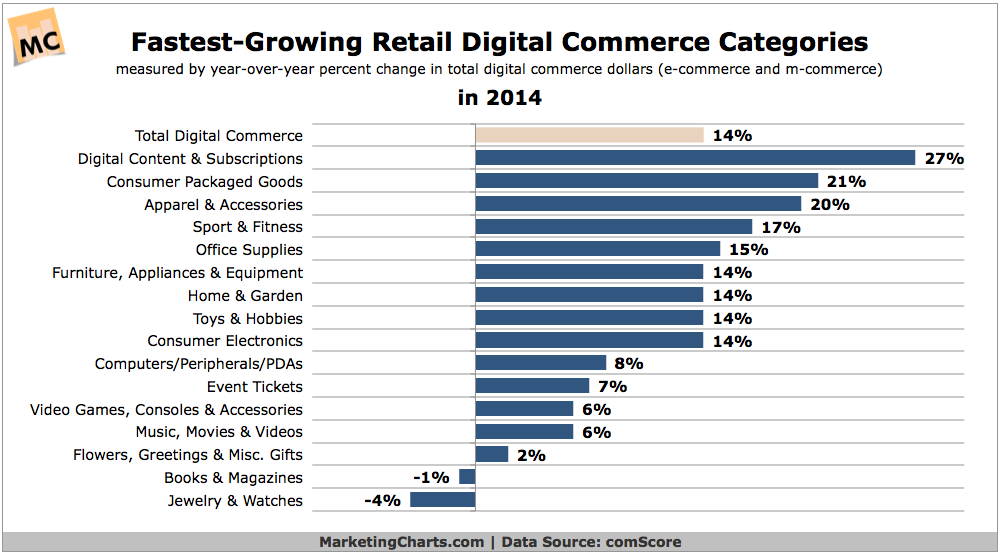
eCommerce and mobile-commerce spending on digital content and subscriptions increased by 27% year-over-year in 2014, almost doubling the overall retail digital commerce growth rate of 14%.
Read MoreTop Brands For Customer Loyalty, February 2015 [TABLE]
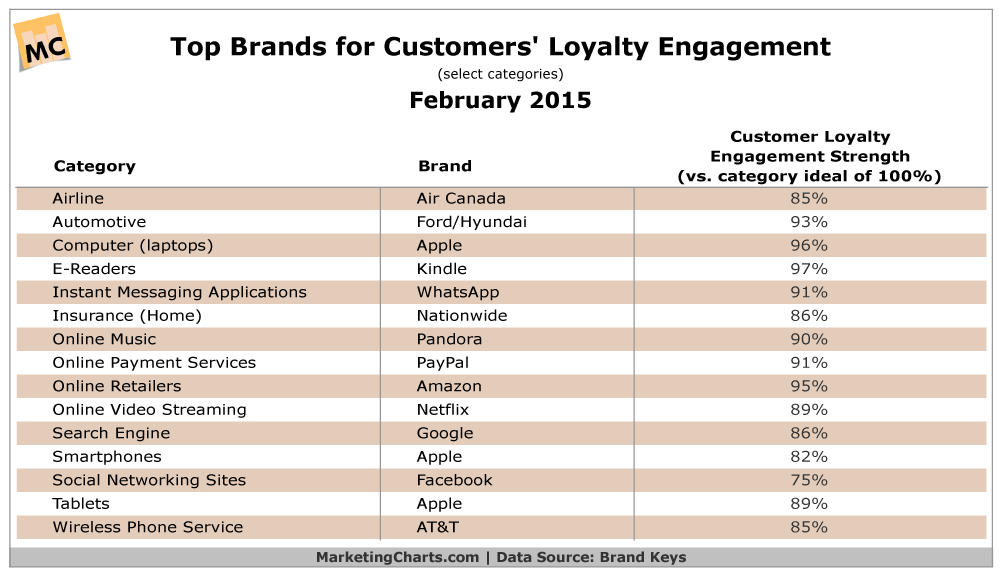
Consumers’ emotional expectations from brands continue to grow but brands are failing to keep pace.
Read MoreBaby Boomers’ Spending Trends, February 2014 [TABLE]
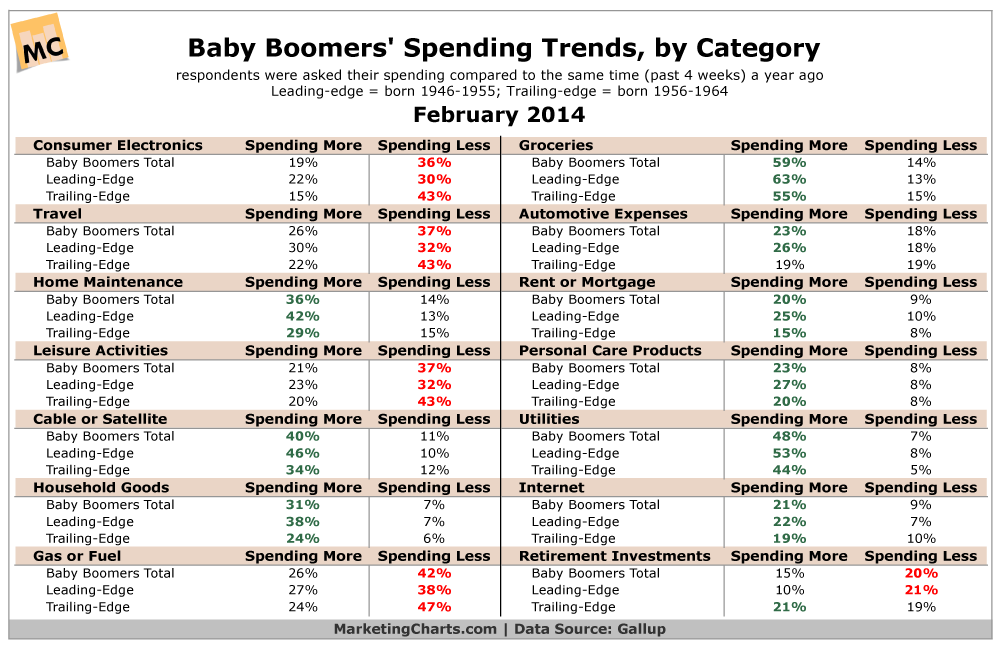
Baby Boomers on the whole report spending more than they were a year ago.
Read MoreWhy People Buy Specific Smart Phone Brands, November 2014 [CHART]
29.1% of consumers said they were most likely to buy or receive a new phone in the next six months.
Read MoreNew Smart Devices Activated Christmas Week By Type, 2012-2014 [CHART]
Phablet devices activated worldwide during the week of Christmas accounted for 13% of total activations—up 225% year over year.
Read MoreTop 5 Smart Device Brands Activated During Christmas Week, 2014 [CHART]
Apple accounted for 51.3% of device activations between December 19 and 25, 2014.
Read More