Posts Tagged ‘Computers’
Time Spent Watching Video On Demand vs. Live Video By Device, Q1 2013 [TABLE]
Digital video viewers were spending substantially longer periods of time watching live video than they were VOD content.
Read MoreDevices College Students Own, June 2013 [CHART]

The average 18-34-year-old college student owns 7 tech devices (6.9 to be precise), up from 6.4 last year.
Read MoreAverage Global Hotel Website Pageviews/Visit by Device, Q4 2012 [CHART]
Tablet users spent much more time on hotel websites, viewing an average of 4.9 pages per visit in Q4 2012, approximately the same as PC users.
Read MoreAffluent Shoppers' Preferred Purchase Channels By Demographic, April 2013 [CHART]
The store still won out as the most common place to make a purchase among affluent consumers, cited by 78% of respondents.
Read MoreWhere Americans Watch TV By Device, January 2013 [TABLE]
While smart mobile device users can now watch TV from anywhere, they still favor sitting at home to watch their shows.
Read MoreTime Americans Spend Watching Mobile TV By Device, January 2013 [CHART]
Only 2% of total TV viewership by American broadband subscribers who watched at least five hours of TV per week occurred on a tablet or smart phone.
Read MoreTelevision Viewing Places By Device, June 2013 [TABLE]
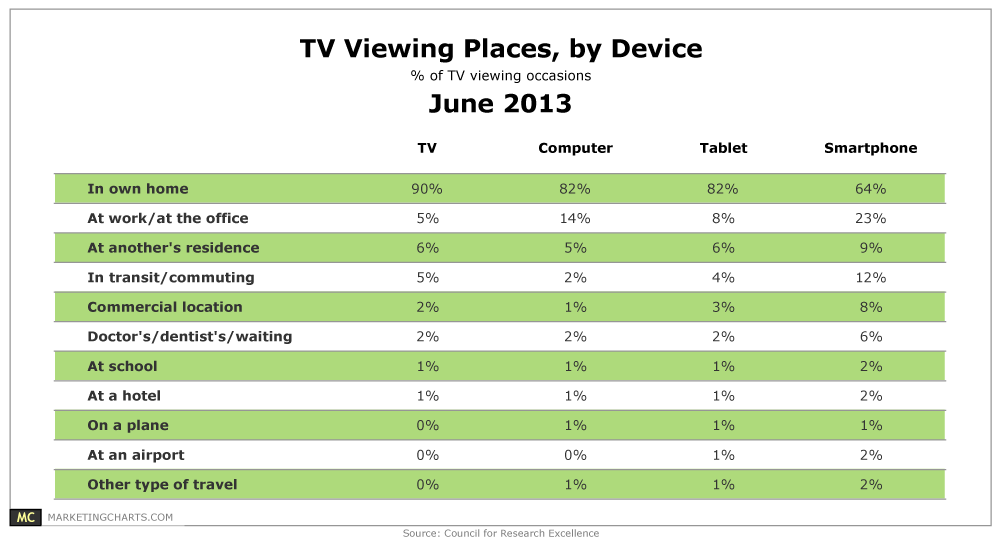
64% of smart phone TV viewing occasions occurred at home.
Read MorePreferred Television Genres By Viewing Device, June 2013 [CHART]
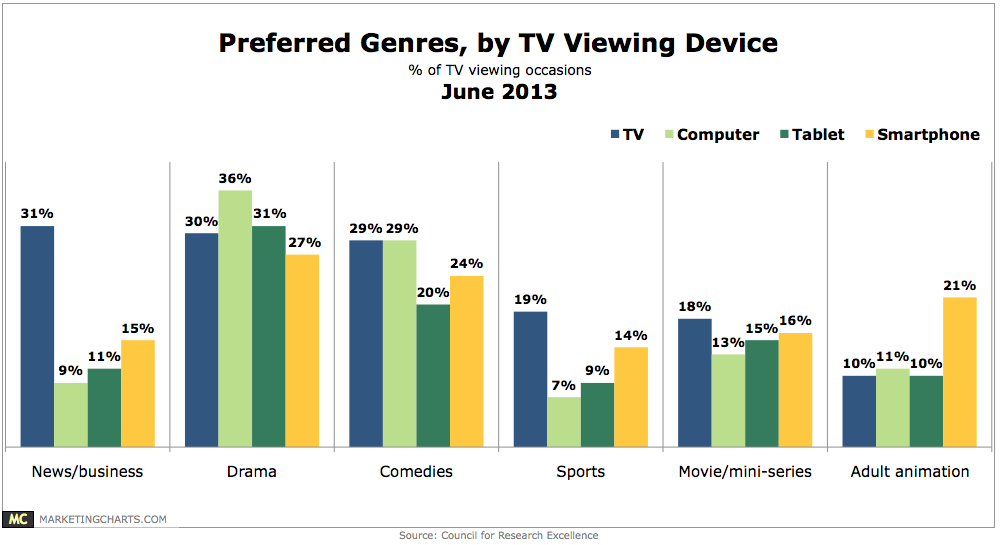
On the traditional TV, news and business (31%) got the edge on drama (30%) and comedies (29%) as the top genres by percentage of viewing occasions.
Read MoreTelevision Consumption By Device, June 2013 [CHART]
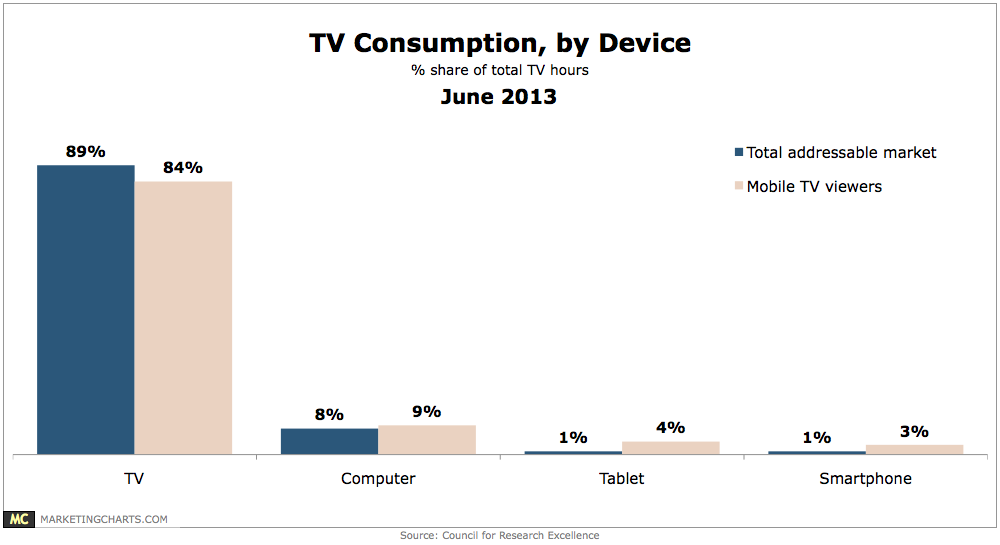
Just 2% of all TV hours logged were on tablets (1%) or smart phones (1%).
Read MoreMobile Users' Internet Access Preferences, May 2013 [CHART]
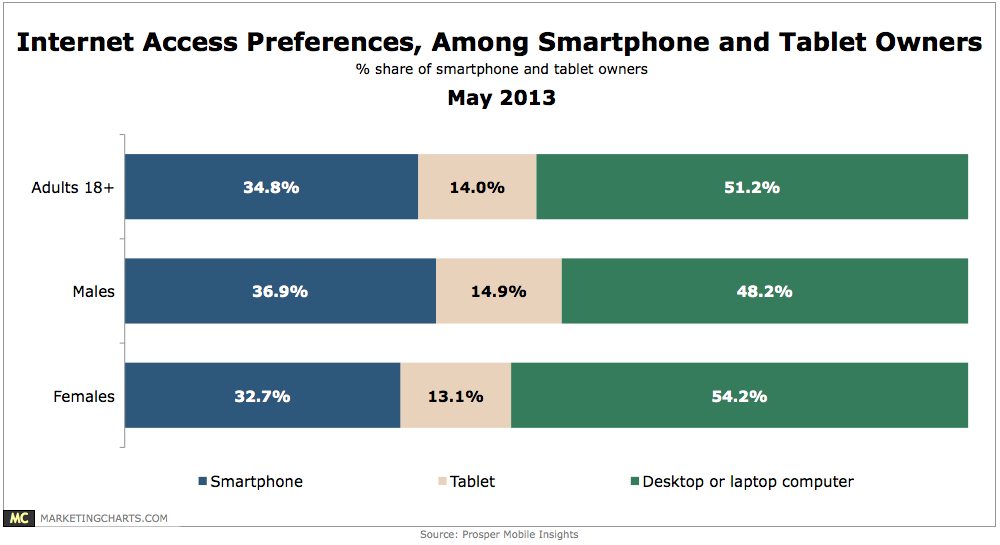
35% of mobile users prefer to access the internet via a smartphone and 14% via a tablet, meaning that only a bare majority still prefer to use their desktop or laptop computer.
Read More