Posts Tagged ‘Computers’
Time Spent On Sports Sites By Device Type, June 2010 & June 2013 [CHART]
US sports leagues and broadcasters are streaming increasing amounts of content on their broadband and mobile channels.
Read MoreUS Internet Users By Device Type, February – July 2013 [CHART]

Mobile has attracted a sizeable bulk of US consumers, but the vast majority use desktop and laptop computers along with mobile devices.
Read MoreImportance Of Screens As Advertising Vehicles, 2013 vs 2016 [CHART]
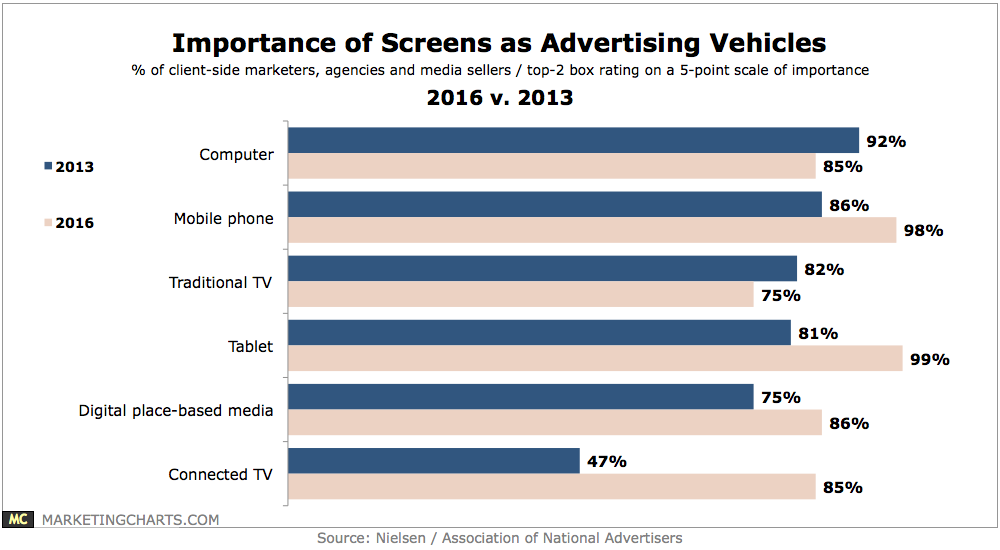
In 3 years’ time, mobile phones and tablets will be more important advertising screens than the traditional TV.
Read MoreGeneration V's Daily Media Consumption, 2011 & 2013 [TABLE]
The number of kids who used a mobile device at least once daily also climbed significantly, going from 8% to 17% from 2011 to 2013.
Read MoreGeneration V's Daily Time Spent With Media By Device, 2011 & 2013 [TABLE]
Younger children are spending less time overall in front of screens, according to an October 2013 survey of US parents with kids ages 8 and younger.
Read MoreDevices Used By Baby Boomers To Consume Online Content, September 2013 [TABLE]
Only four in 10 of boomers used a mobile device to get online, with three in 10 accessing it on a smartphone and one in five via a tablet.
Read MoreMobile vs. Desktop Video Engagement Rates, Q3 2013 [CHART]
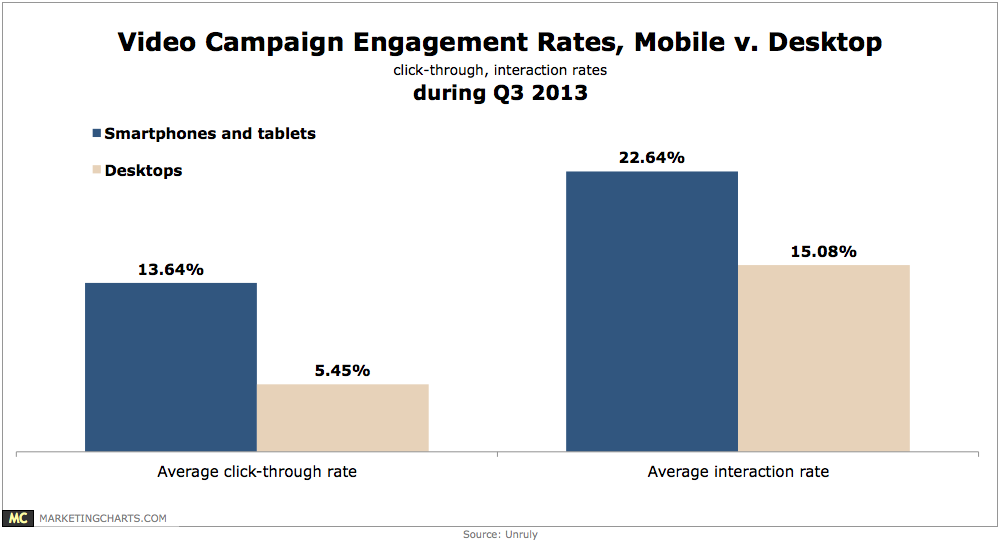
The average click-through rate (CTR) for video campaigns in Q3 was almost three times higher on smart phones and tablets (13.64%) than on desktops (5.45%).
Read MorePrimary Entertainment Devices For Young Mobile Users, October 2013 [CHART]
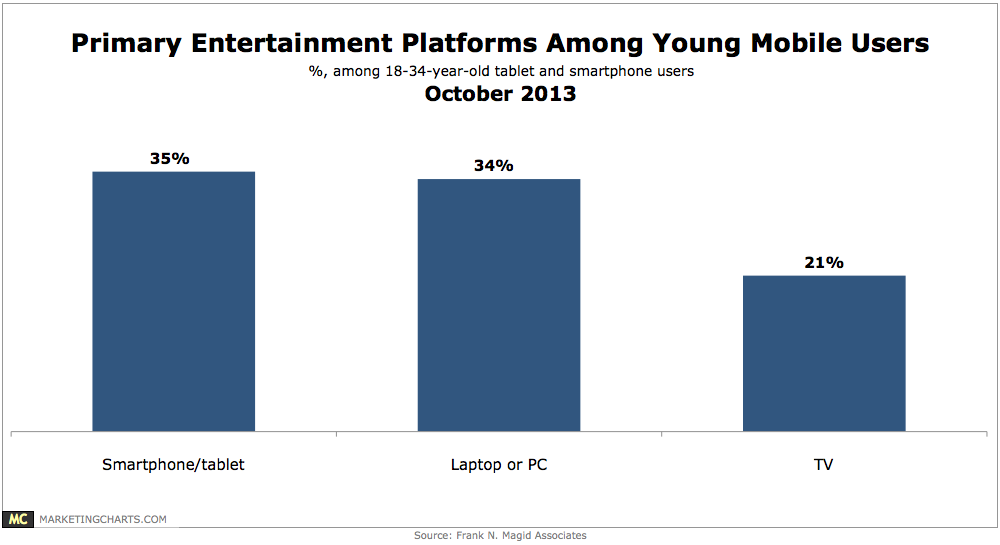
Among 18-34-year-old smart phone and tablet users, a leading 35% count those devices as their primary entertainment medium.
Read MoreUS Travel & Leisure Search Advertising Click Share By Device, Q2 2012-Q2 2013 [CHART]
Tablet and smart phone click shares for paid search ads in the travel and leisure category have increased more than 60% between Q2 2012 and Q2 2013.
Read MoreDevices Used By Luxury Goods Buyers, April 2013 [CHART]
Luxury buyers used an average of 3.1 digital devices, compared with 2.9 devices for the general population.
Read More