Posts Tagged ‘Click-Through Rates’
Facebook Ad Performance Metrics, Q2 2013 [CHART]
Facebook click-through rates were up by 18.5% quarter-over-quarter, leading to a 15.9% drop in average cost-per-click and a 16.4% rise in clicks.
Read MoreEmail Open & Click-Through Rates By Personalization, 2012 [CHART]
63% of consumers in the US and UK believe that they receive so many messages that use their name that it no longer makes any difference to them, recent research suggests. But consumers’ behavior may not support their perceptions.
Read MoreTriggered Email Marketing Metrics In North America, Q1 2011 – Q1 2013 [TABLE]
To drive greater engagement with email, whether on desktop or mobile, companies are using marketing automation via triggered messaging.
Read MoreEmail Marketing Metrics In North America, Q1 2012 & Q1 2013 [TABLE]

Click-to-open rate dropped 9.6% year over year, and transaction-to-click rate fell 15.6%.
Read MoreEmail Marketing Metrics In North America, Q1 2011-Q1 2013 [CHART]
Nearly one in three emails sent in North America during Q1 2013 were opened—the highest number in recent history.
Read MoreOnline Ad Metrics By Select Industries, 2012 [CHART]
In many cases, the only people with a clear grasp of advertising metrics are in the digital department.
Read MoreIn-App vs. Web Mobile Ad Click Rates, May 2013 [CHART]
Users were about 37% more likely to click on an rich media in-app ad than on a mobile rich media web ad (1.53% vs. 1.12%).
Read MoreEmail Open & Click-Through Rates, Q4 2009-Q1 2013 [CHART]
The average email open rate in North America climbed to 31.1% in Q4, a significant increase from 27.4% in Q4.
Read MoreGlobal Facebook Ad Performance Metrics By Type, March 2013 [TABLE]
The sponsored check-in story achieved the highest clickthrough rate (CTR) by a significant margin.
Read MoreMost Important Multi-Screen Video Ad Metrics, June 2013 [CHART]
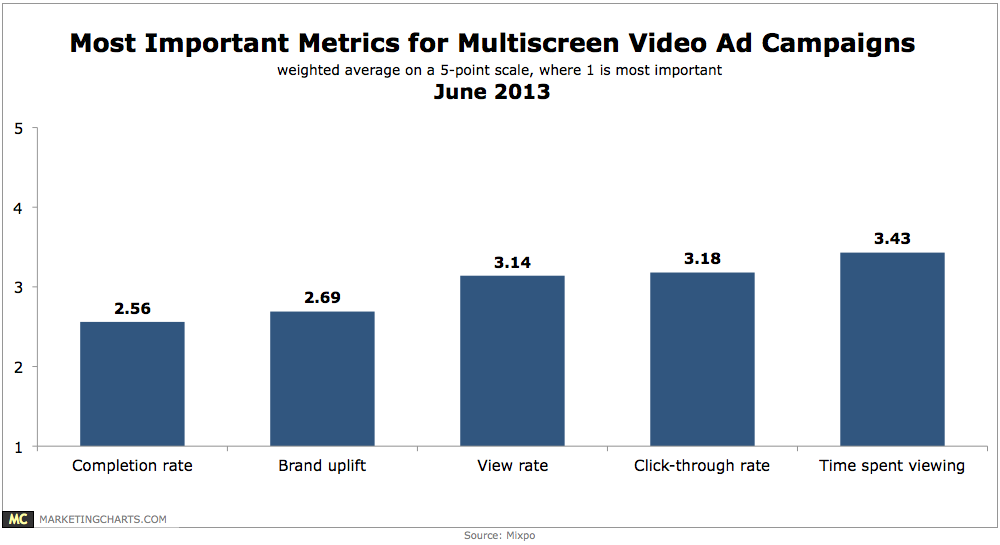
While completion rate (with a rating average of 2.56, where 1 is most important) shows up as the most important metric, brand uplift (2.69) is close behind in value.
Read More