Posts Tagged ‘Click-Through Rates’
Email Metrics By Daypart, Q4 2013 [TABLE]
Emails sent during the nighttime hours of 8pm to 12am saw the highest unique open rates, click rates, transaction rates and revenue per email.
Read MoreEmail Marketing Metrics By Day Of Week, Q4 2013 [TABLE]
Saturday had the highest open rates and average order sizes compared with all other days.
Read MoreSearch Advertising Trends, Q2 2014 [TABLE]
Various sources were in agreement that US paid search spending grew in Q2.
Read MoreFacebook Advertising Benchmarks, Q2 2013 vs Q2 2014 [CHART]
The average click-through rate for Facebook ads on desktop and mobile platforms in Q2 was 0.36%.
Read MoreMetrics Brands Use To Measure Social Content Effectiveness, April 2014 [CHART]

80% of US client-side marketers measured the effectiveness of their social content, with social media metrics such as Likes the most common.
Read MoreMobile Email Benchmarks By Industry, Q1 2014 [CHART]
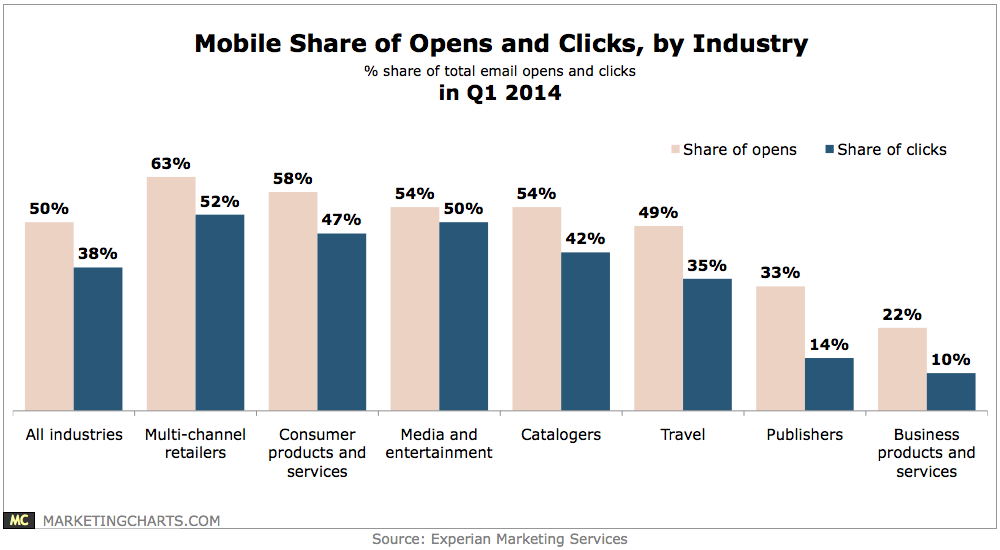
Half of total email opens occurred on a mobile device in Q1 2014.
Read MoreUS Email Marketing Benchmarks, 2013 [CHART]
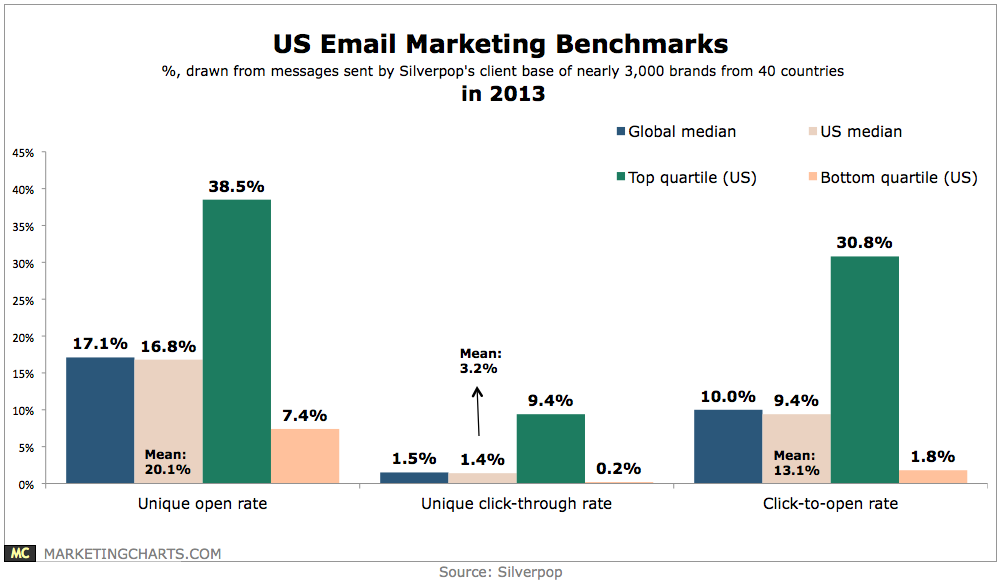
The mean unique open rate for US email marketers last year was 20.2% and the median rate 17.1%.
Read MoreFacebook Mobile Advertising Metrics, Q1 2014 [TABLE]
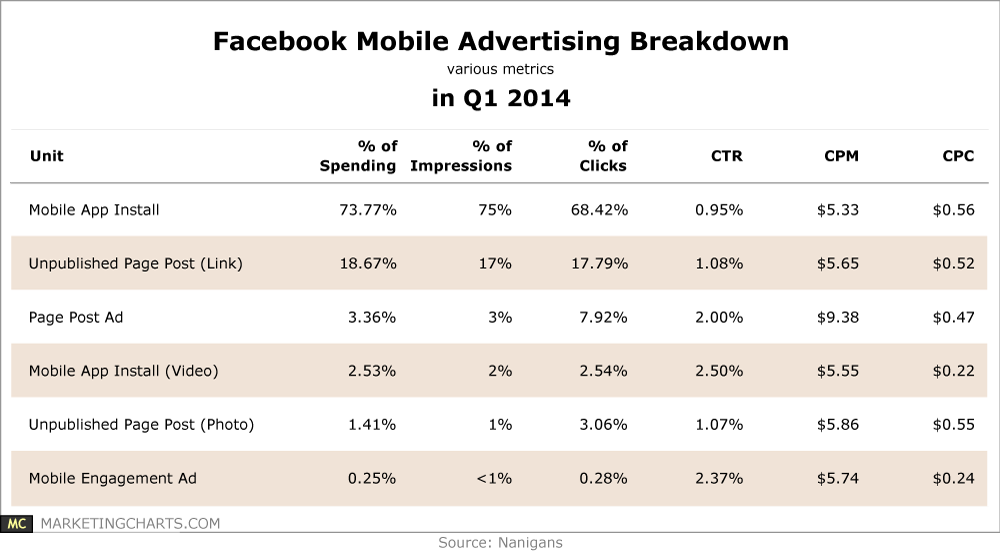
Almost three-quarters of Facebook mobile ad spending was directed at mobile application install ads in Q1.
Read MoreOnline Display Ad Benchmarks By Region in 2013 [CHART]
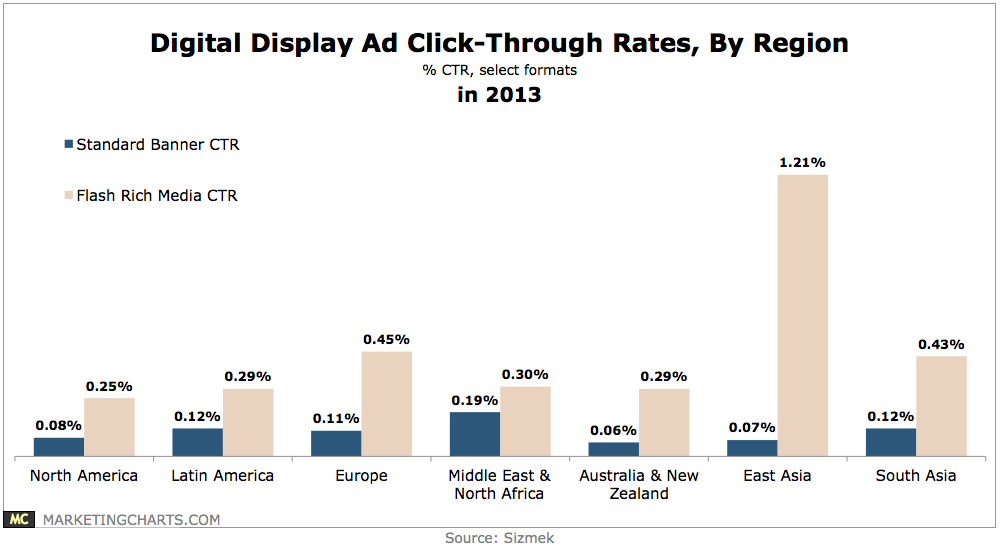
In North America, the average click-through rate (CTR) for standard banners slipped from 0.1% to 0.08%, while flash rich media CTRs jumped from 0.14% to 0.25%.
Read MoreSearch Advertising Trends, Q1 2014 [TABLE]
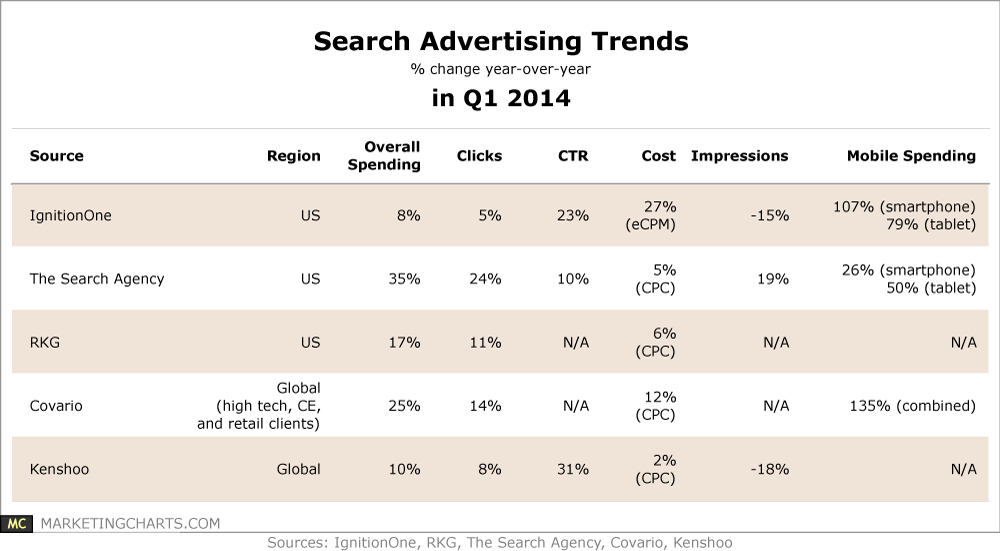
Spending is up (particularly on mobile), as are click-through rates.
Read More