Posts Tagged ‘Click-Through Rates’
Click-Through Rate For US Facebook Ads By Industry, Q4 2014 [CHART]
Clickthrough rates (CTRs) for US Facebook ads showed impressive growth throughout 2014.
Read MoreEffect Of Monthly Email Campaign Frequency On Click Rate [CHART]
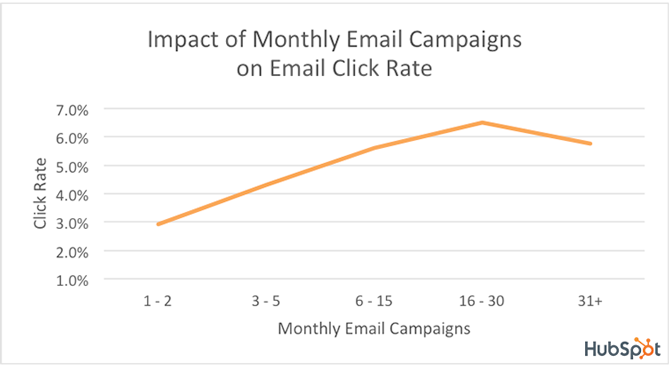
companies that send 16-30 campaigns a month see a click rate more than two times greater than the click rate of companies that send two or fewer campaigns a month.
Read MoreEmail Open & Click-Through Rates, 2010-2014 [CHART]
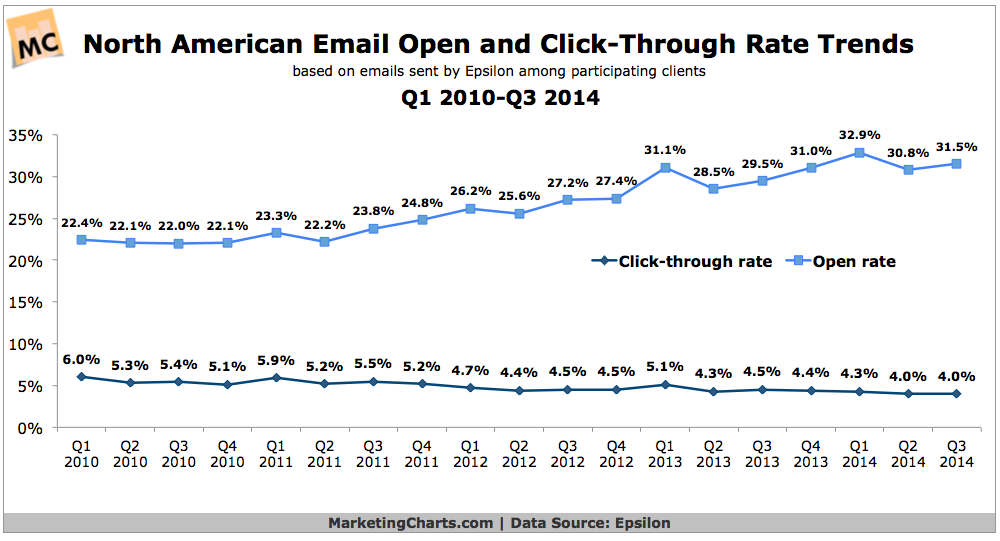
Open rates are gradually climbing while click rates take the opposite direction.
Read MoreApp Push Message Click Rates, November 2014 [CHART]
App push messages sent during the week have on average 66% higher click-through rates than those sent on the weekend.
Read MoreEmail Click-Through Rates By Hour, 2013 [CHART]
Trends surrounding click rates by hour scheduled are very similar to those surrounding open rates by hour scheduled.
Read MoreEmail Engagement By Device Type, December 2014 [CHART]
PCs accounted for 72.2% of overall clicks for the subset of email addresses examined in the study, despite representing a smaller 64.2% of email addresses.
Read MoreMobile In-App Ad Monetization By Day Of The Week, Q3 2014 [CHART]
The highest click-through rates and eCPMs for in-app ads were on Thursdays and Fridays.
Read MoreUS Paid Search CTR By Ad Position & Device, Q2 2014 [TABLE]
CTRs were better for first-position paid search ads run in the US on smartphones, tablets and desktops, with respective rates of 4.9%, 4.3% and 3.2%.
Read MoreEffect Of Select Mobile Ad Optimization Tactics, H1 2014 [TABLE]
Optimizing for CTR raised CTRs for US retail mobile ads by 40%, while restaurant and auto ads were up 33% and 16%, respectively.
Read MoreAmazon.com Search Click-Through Rates By Position, November 2014 [CHART]
There is only a 19.7% chance that Amazon.com shoppers would view the second page of search results.
Read More